Corporate Earnings Are Down, But Debt Keeps Rising…
Stock-Markets / Stock Markets 2016 Jan 26, 2016 - 04:04 PM GMTBy: Harry_Dent

 I recently wrote to you about a number of factors that show the stock market saw a major top back in May 2015.
The most glaring?
Small-cap stocks have diverged massively from large-cap since May. They’re down 24% while large-caps are down only 12%. This is the classic sign that the dumb money is pouring in and the smart money is leaving.
Then there’s a classic head and shoulders topping pattern that was initially broken last Friday, January 15, when the S&P 500 moved below 1,880 (next stop is 1,595). I sent Boom & Bust subscribers an alert about this 30 minutes after the markets opened, telling them what is likely to happen next.
Few analysts are talking about this head and shoulders pattern… but even fewer are talking about the 800-pound gorilla in the room…
That is: earnings.
Sales have been down for S&P 500 companies for the last three quarters. They’ll almost certainly be down for the 4th quarter now that retail sales for December came in down 0.1%.
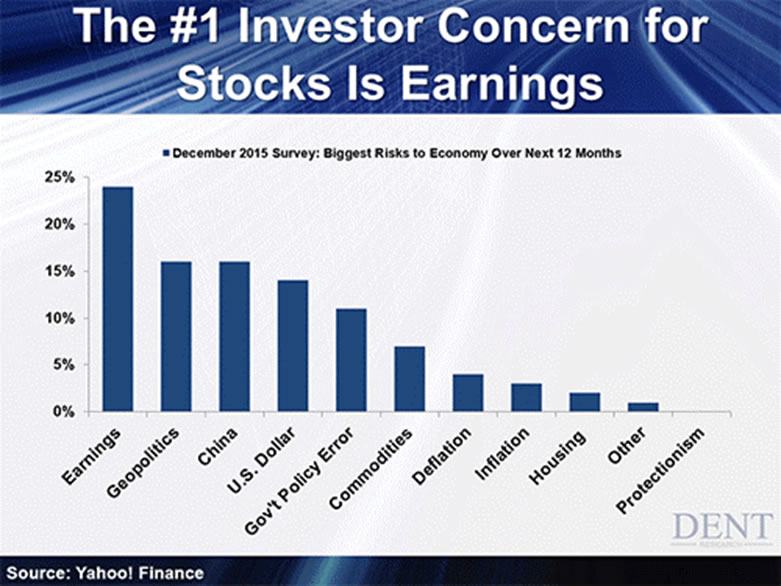
Look at this client survey from Citi Research, one of those few analyst groups along with us and our resident Forensic Accountant, John Del Vecchio, who are pointing to the gorilla.

As you can see, the number one risk – by far – is earnings, at 24.5%. Next, at 15.5%, is geopolitical risk, which I’ve been talking about for years now. My 35-Year Geopolitical Cycle is one of the four in my hierarchy of cycles which allow me to forecast with such accuracy. For me, that and China are the two biggest red flags on my radar, presenting the highest risk to us.
And, thanks to John, earnings became another of those red flags when he joined us to launch his service, Forensic Investor.
Other red flags flapping in the wind right now are the dollar and government policy management missteps in the shape of the Fed raising rates too fast. In particular, here’s one that’s particularly worrisome to me (if you’re a sensitive reader, now would be the time to stop and move on with your day)…

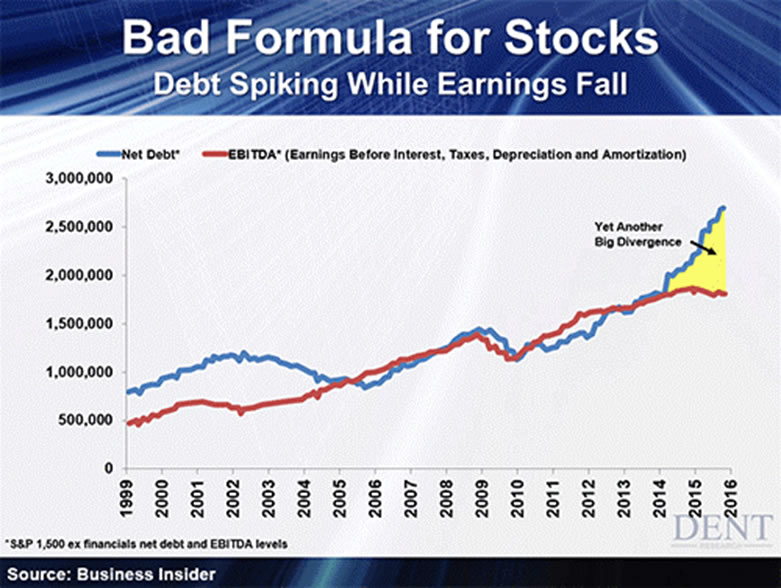
Look at how debt is diverging above a broader measure of earnings (EBITDA, which is earnings before interest, tax, depreciation and amortization).
Debt has gone stark raving mad. Actually, borrowers and lenders have gone stark raving mad, sending debt levels into the stratosphere, but let’s not split hairs. Insane is insane. And we have zero interest rate policies (ZIRP) to thank for the big balloon of bowling balls about to rip open and drop onto our heads.
The last time debt exceeded earnings was in the 2001 recession due to weakening earnings.
More importantly, we didn’t see a surge in debt versus earnings in the 2008/2009 top or recession. That’s because companies had to pay real interest rates back then. That was when the Fed was tightening, as they normally do in the late stages of a boom.
Since late 2014, however, debt has ballooned out of all proportions while earnings have flattened and even started to decline. And we haven’t even entered the next recession yet!
When you look at quarterly earnings instead of EBITDA, it’s even worse...
Normal S&P 500 earnings per share are expected to drop for the second straight quarter in Q4.
All of this is a sure sign that the stock bubble is over and that we’re heading into a recession. John believes we’re in for an even steeper drop in earnings ahead. I 100% agree.
John’s actually preparing an online exclusive called “Earnings Exposed,” which will broadcast on January 28. He’s asked that we get the word out to as many people as we can so they can watch when this airs in a few weeks’ time.
During this exclusive, which will initially broadcast at 4 p.m. Eastern Time – don’t worry, we’ll send you a reminder with a link that will take you to the online exclusive – John‘s going to uncover the real reason this earning’s season has turned out so poorly (as he knew it would), and he’s going to show you what’s going to happen next. There will be a rebroadcast at 8 p.m. for anyone who can’t watch the first airing.
To watch it though, you’ve got to sign up, so do so here now… when you click on this link, it will automatically sign you up. You won’t need to do anything else except watch out for the confirmation email we’ll send to you.
In the meantime, get on your safety jackets because this roller coaster ride is just getting started.
Harry
Follow me on Twitter @HarryDentjr
Harry studied economics in college in the ’70s, but found it vague and inconclusive. He became so disillusioned by the state of the profession that he turned his back on it. Instead, he threw himself into the burgeoning New Science of Finance, which married economic research and market research and encompassed identifying and studying demographic trends, business cycles, consumers’ purchasing power and many, many other trends that empowered him to forecast economic and market changes.
Copyright © 2016 Harry Dent- All Rights Reserved Disclaimer: The above is a matter of opinion provided for general information purposes only and is not intended as investment advice. Information and analysis above are derived from sources and utilising methods believed to be reliable, but we cannot accept responsibility for any losses you may incur as a result of this analysis. Individuals should consult with their personal financial advisors.
© 2005-2022 http://www.MarketOracle.co.uk - The Market Oracle is a FREE Daily Financial Markets Analysis & Forecasting online publication.


