


Charting The Stock Market Crash - How Far Will The Bounce Get?...
Stock-Markets / Financial Crash Jan 24, 2016 - 04:18 PM GMTBy: Clive_Maund

 The purpose of this update is to define exactly where we are on the market clock, because if we know where we are, broadly speaking we will know where we are going.
Before going any further I want to point out that so far we have tracked this nascent market crash well, first looking for the market to cave in last Summer, in the Preparing for the Crash series, calling for the Biotech sector to plunge before Christmas in Biotech Inverse ETFs update – Perfect Entry Point for New Shorts, for China to crater at the end of December in the China update and more recently calling for a waterfall decline in the US stockmarket right at the start of the year in Broad US Stockmarket Still Perched Atop a Cliff
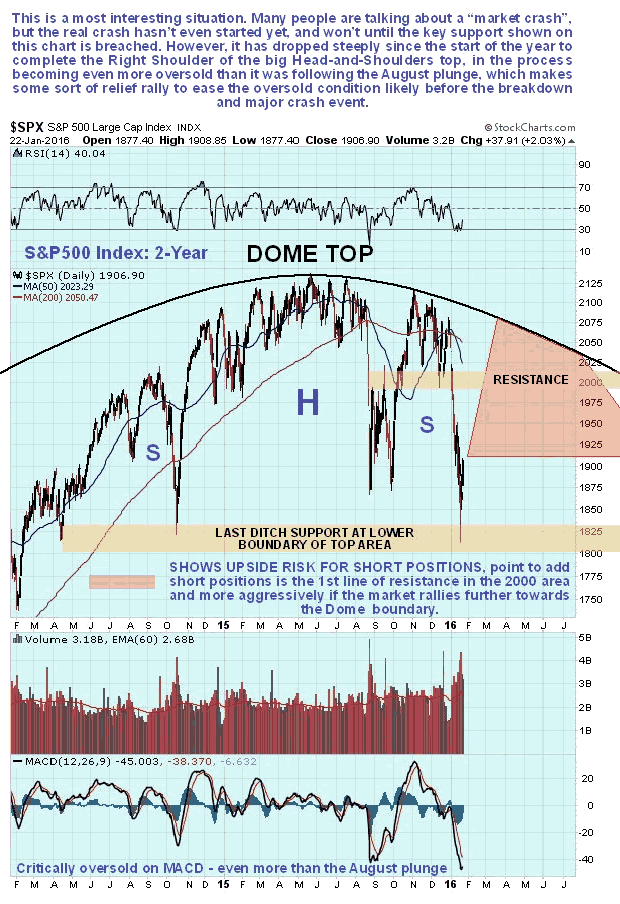
Last week the market plunged to arrive at the last ditch support level in the 1800 - 1850 zone on the S&P500 index that we had earlier defined as marking the lower boundary of the giant Head-and-Shoulders top. Once this level is breached, the full-on crash starts. Because it arrived at this support level in an even more oversold state than it was at the depths of the plunge last August, and because Smart Money has become bullish, it made it unlikely that it would break down and crash just yet, and sure enough the market has started to bounce, which means that the danger has probably abated, for now. The stabilization of the market here is expected to generate a short covering bounce, regardless of the rotten fundamentals, and as it unfolds the "reasons" for it will be presented in the mainstream financial media as "Market responds to stimulus talk" etc. The big question now is how far this bounce is likely to get, and that is what we are going to attempt to determine here, because it is crucial for the purpose of piling on short positions at the optimum juncture at the best prices in the future.
Smart Money is looking for a bounce...
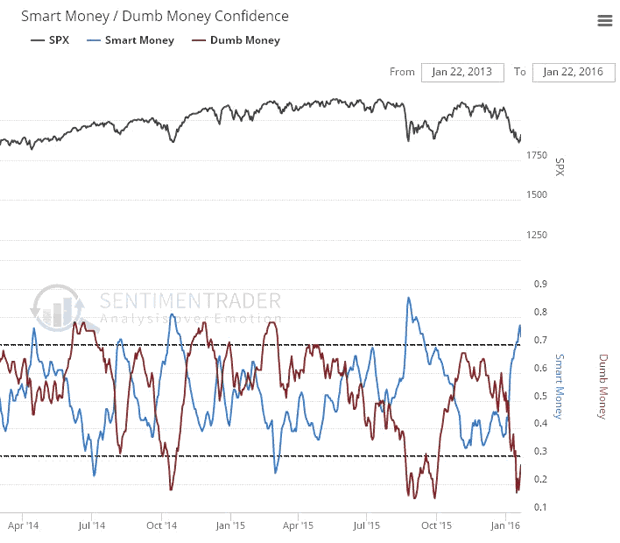
Chart courtesy of www.sentimentrader.com
Whilst no-one can be sure how far this bounce will get, possibilities vary from it being over already to it making it all the way back up to the Dome boundary shown on our charts, as it did after the August plunge, it will likely be sufficient to substantially alleviate the current extremely oversold condition and so create the conditions for the full-on crash phase, which means that it is likely to rally at least to the resistance in the 1980 - 2000 area shown on the 2-year chart for the S&P500 index, and it could even make it all the way back up to the Dome boundary again, although this is considered highly unlikely, the reason being that we are not looking for symmetry on the way down - since markets drop on average twice as fast in bearmarkets as they rise in bullmarkets, the market should not keep rising up to the Dome boundary on rallies, certainly not after it breaks down from the Head-and-Shoulders top.
So, the relief rally should take the S&P500 index somewhere into the red box shown on our chart, probably to the resistance level, but perhaps a little higher or lower. We will be watching in an effort to gauge where it is going to stop, which is where we will ditch any short-term long trades and pile on the shorts again.
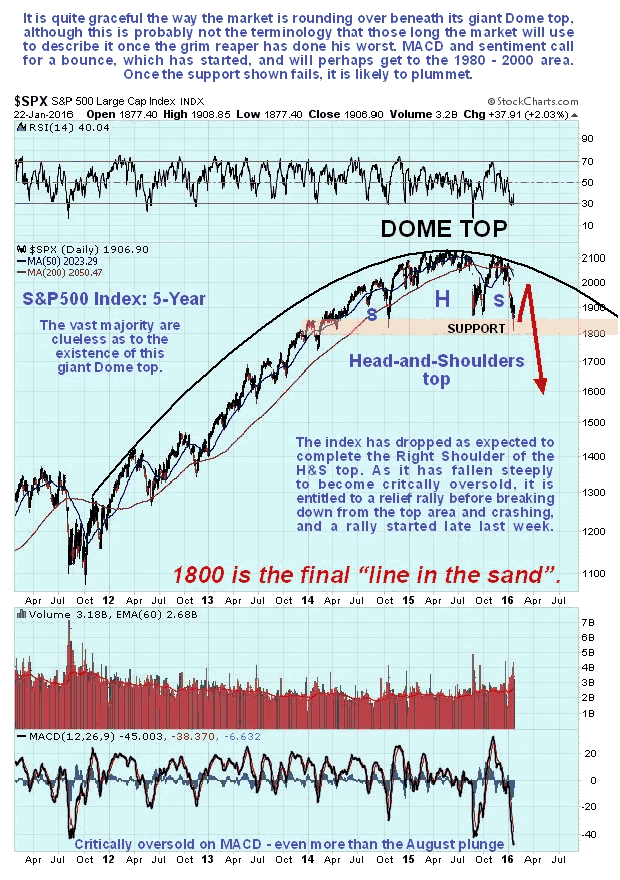
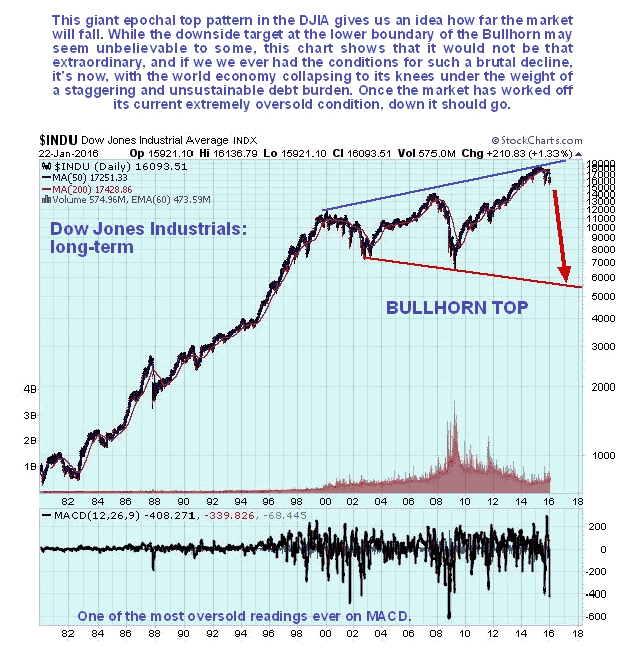
The longer-term 5-year chart provides more perspective and enables us to see the origin point of the Dome top and better appreciate the downside risk should the support at the lower boundary of the Head-and-Shoulders fail in due course as expected. Actually, you need to go back a lot further than this to understand just how far this market can drop, which is better understood on the long-term chart for the Dow Jones Industrials shown below which goes back to 1980. This chart gives a downside target in the 5,500 area (it's now at almost 17,000), achievable within a year or so, which might seem incredible to many, but is certainly well within the bounds of possibility, as this chart makes plain, and if ever the conditions existed for such a devastating decline, it's now. This means that the market should lose two-thirds of its value. Note that the Dow Jones Industrials are used in preference to our normal S&P500 index here because they fit the Bullhorn pattern better.
Remember that we are at the end of an era, with the entire debt-wracked Ponzi scheme that the world economy has now become set to go down in a ball of flames like the Hindenburg , a reset that will involve unprecedented devastation including wars and revolutions, yet from an evolutionary standpoint is an absolute necessity. Fiscal restraint and discipline, having been abandoned for decades now, will be imposed by force, the force of the markets, and discredited Keynesian economics will be consigned to the garbage can of history where it belongs, and some sort of gold standard re-introduced.
By Clive Maund
CliveMaund.com
For billing & subscription questions: subscriptions@clivemaund.com
© 2016 Clive Maund - The above represents the opinion and analysis of Mr. Maund, based on data available to him, at the time of writing. Mr. Maunds opinions are his own, and are not a recommendation or an offer to buy or sell securities. No responsibility can be accepted for losses that may result as a consequence of trading on the basis of this analysis.
Mr. Maund is an independent analyst who receives no compensation of any kind from any groups, individuals or corporations mentioned in his reports. As trading and investing in any financial markets may involve serious risk of loss, Mr. Maund recommends that you consult with a qualified investment advisor, one licensed by appropriate regulatory agencies in your legal jurisdiction and do your own due diligence and research when making any kind of a transaction with financial ramifications.
Clive Maund Archive |
© 2005-2022 http://www.MarketOracle.co.uk - The Market Oracle is a FREE Daily Financial Markets Analysis & Forecasting online publication.