


Stocks Bear Market Underway
Stock-Markets / Stocks Bear Market Jan 16, 2016 - 04:33 PM GMTBy: Tony_Caldaro

 First things first. An equity bear market has been confirmed on Friday by OEW. The market started the week at SPX 1922. After three gap up openings the market gyrated its way up to SPX 1950 by Wednesday, then started to head lower. Thursday also had a gap up opening, and the market recovered to SPX 1934. Friday, however, we had a big gap down opening and the market traded down to SPX 1858 before recovering to end the week at 1880. For the week the SPX/DOW lost 2.20%, the NDX/NAZ lost 3.15%, and the DJ World index lost 3.0%. Economic reports for the week were nearly all negative. On the uptick only Consumer sentiment. On the downtick: export/import prices, retail sales, the PPI, the NY FED, industrial production, capacity utilization, business inventories, the WLEI, the GDPn, plus the treasury deficit and weekly jobless claims rose. Next week we get reports on the Philly FED, the CPI, and Housing.
LONG TERM: bear market
After 6+ years of a rising stock market, which more than tripled, the bull market ended with a very rare, (in fact I don’t recall ever seeing one of this degree), failed fifth wave pattern in December, 2015.
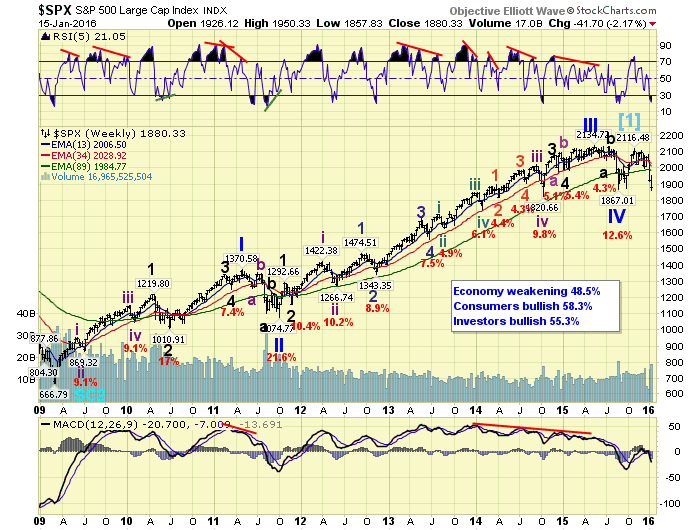
After the market sold off sharply in August to complete Primary wave IV, we suggested two possible scenarios for the months ahead. First, if the market made new highs during the first uptrend the bull market would be over when that uptrend ended. Second, if the market failed to make new highs during the first uptrend Primary wave V will probably extend. This market did neither of those two options. It failed to make new highs during the first uptrend and topped. Don’t recall ever seeing this either. It has been that kind of bull market. One hundred and thirty years of stock market data and it is still doing new things.
We have been labeling this bull market as a five primary wave Cycle wave [1]. Primary waves I and II ended in 2011; and Primary waves III, IV and V ended in 2015. A Cycle wave [2] bear market is now underway. Historically, Cycle wave bear markets have lost 45% to 50% of market value. This would suggest a bear market low around SPX 1100 over the next year or so. The market closed on Friday at SPX 1880.
MEDIUM TERM: downtrend
In anticipation of a potential bear market confirmation we examined all four major indices to determine the actual bull market high. The four indices staggered their actual print highs throughout the year. The SPX/DOW topped in May, the NAZ topped in July, and the NDX topped in December. The only alignment of the four came in August when they all hit the labeled Primary IV low. With that in mind we took a close look at uptrend in the SPX, since we follow that one closely, after that low.
What we observed was a clear five wave rally 1867-1993; an irregular correction 1903-2021-1872 ending with a clear five waves down; a very strong impulsive 240 point rally to 2116; a pullback to 2019; then a five wave rally to 2104 ending in a diagonal triangle. We at first labeled this as Major waves up expecting Primary V to make new highs. Then we downgraded it to a Major 1 uptrend when it failed to make new highs. This was wrong, and we were right the first time around, it was all of Primary V.
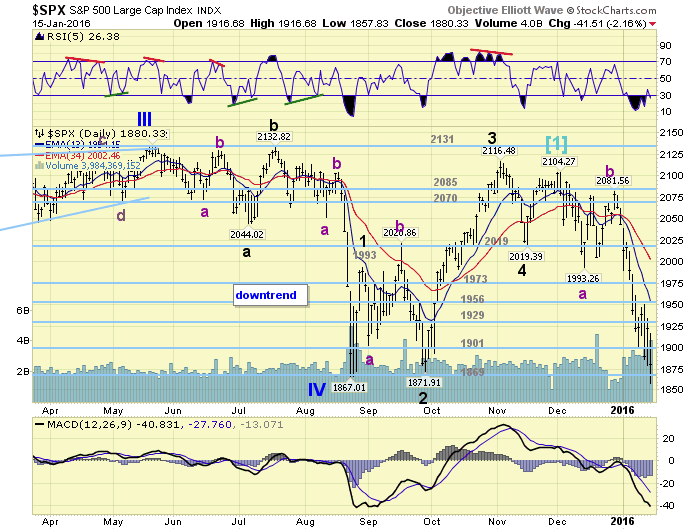
The fact that the last rally, SPX 2019-2104, ended in a diagonal triangle. The rally was a failed fifth wave for the uptrend. And, the entire uptrend was a failed fifth wave for the bull market makes it compelling evidence that it was a failed Primary wave V. Regardless of how others may want to label it a bear market is underway.
Under the failed fifth primary wave scenario, the market is currently in its first downtrend of a new bear market. Bear markets always unfold in corrective patterns. Some are quite complex, like 2000-2002, others are rather simple, like 2007-2009. There is no way of telling ahead of time whether this one will be simple or complex, until a few trends have unfolded. Yes, bear markets have uptrends and downtrends like bull markets. Only the main direction of the overall market is in opposite direction.
SHORT TERM
Counting from the failed fifth, of the failed fifth at SPX 2104. We have an abc down to SPX 1993, an abc rally to 2082, and now a more complex abc decline to 1858 so far. Correct, I do not see any of these declines as impulse waves. Currently this second stronger decline is a near perfect double of the first decline, i.e. 224 points v 111 points. If Friday’s low does not hold, a 2.618 relationship would suggest a downtrend low around SPX 1791. There is not much else to go on at the moment except for the OEW pivots.
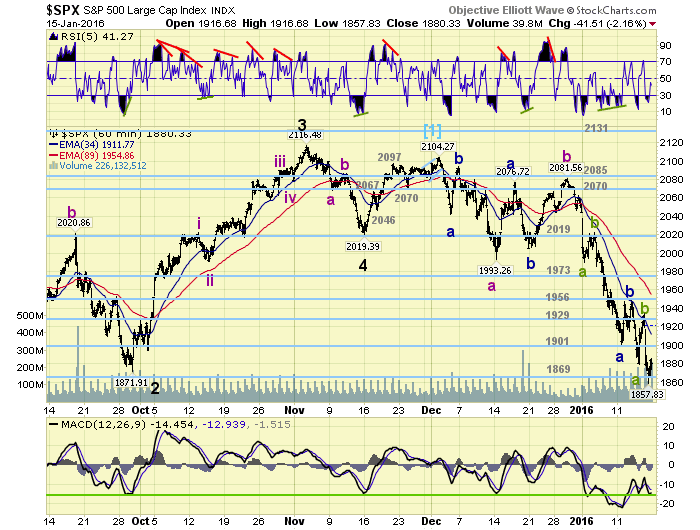
Short term support is at the 1869, 1841, 1828 and 1779 pivots, with resistance at the 1901 and 1929 pivots. Short term momentum ended the week near neutral. Bear markets are usually quite turbulent and volatile events. Best to your trading!
FOREIGN MARKETS
Asian markets were all lower on the week for a net loss of 3.5%.
European markets were also all lower for a net loss of 3.1%.
The Commodity equity group were all lower and lost 6.1%.
The DJ World index continues to downtrend and lost 3.0%.
COMMODITIES
Bonds are in an uptrend and gained 0.8% on the week.
Crude continues its downtrend and lost 6.7% on the week.
Gold is still in an uptrend but lost 1.4% on the week.
The USD is trying to uptrend and gained 0.4% on the week.
NEXT WEEK
Monday: holiday. Tuesday: the NAHB at 10am. Wednesday: the CPI, Housing starts, and Building permits. Thursday: weekly Jobless claims and the Philly FED. Friday: Existing home sales and Leading indicators. Best to your three day weekend and week!
CHARTS: http://stockcharts.com/public/1269446/tenpp
After about 40 years of investing in the markets one learns that the markets are constantly changing, not only in price, but in what drives the markets. In the 1960s, the Nifty Fifty were the leaders of the stock market. In the 1970s, stock selection using Technical Analysis was important, as the market stayed with a trading range for the entire decade. In the 1980s, the market finally broke out of it doldrums, as the DOW broke through 1100 in 1982, and launched the greatest bull market on record.
Sharing is an important aspect of a life. Over 100 people have joined our group, from all walks of life, covering twenty three countries across the globe. It's been the most fun I have ever had in the market. Sharing uncommon knowledge, with investors. In hope of aiding them in finding their financial independence.
Copyright © 2016 Tony Caldaro - All Rights Reserved Disclaimer: The above is a matter of opinion provided for general information purposes only and is not intended as investment advice. Information and analysis above are derived from sources and utilising methods believed to be reliable, but we cannot accept responsibility for any losses you may incur as a result of this analysis. Individuals should consult with their personal financial advisors.
Tony Caldaro Archive |
© 2005-2022 http://www.MarketOracle.co.uk - The Market Oracle is a FREE Daily Financial Markets Analysis & Forecasting online publication.