


Crude Oil Price Closed Week under 2009 Low!
Commodities / Crude Oil Jan 11, 2016 - 05:16 PM GMTBy: Nadia_Simmons

 Trading position (short-term; our opinion): Short positions (with a stop-loss order at $39.12) are justified from the risk/reward perspective.
On Friday, crude oil lost 1.14% as concerns over a global supply glut, the situation in China and the Middle East continued to weigh on investors sentiment. Thanks to these circumstances, light crude closed the week under the 2009 low. Does it mean that we’ll see a test of the barrier of $30 in the coming weeks?
Although Friday’s Baker Hughes report showed that U.S. oil rigs fell by 20 to 516 (which was the third consecutive week of weekly drops), concerns over crude oil demand caused by the recent massive sell-off in China (as a reminder, China consumes around 10.5 million barrels per day, which makes the country the world's second-largest consumer of oil) continued to weigh and resulted in a weekly closure under the 2009 low. Will we see a test of the barrier of $30 in the coming weeks? Let’s examine charts and find out (charts courtesy of http://stockcharts.com).
Quoting our Friday’s alert:
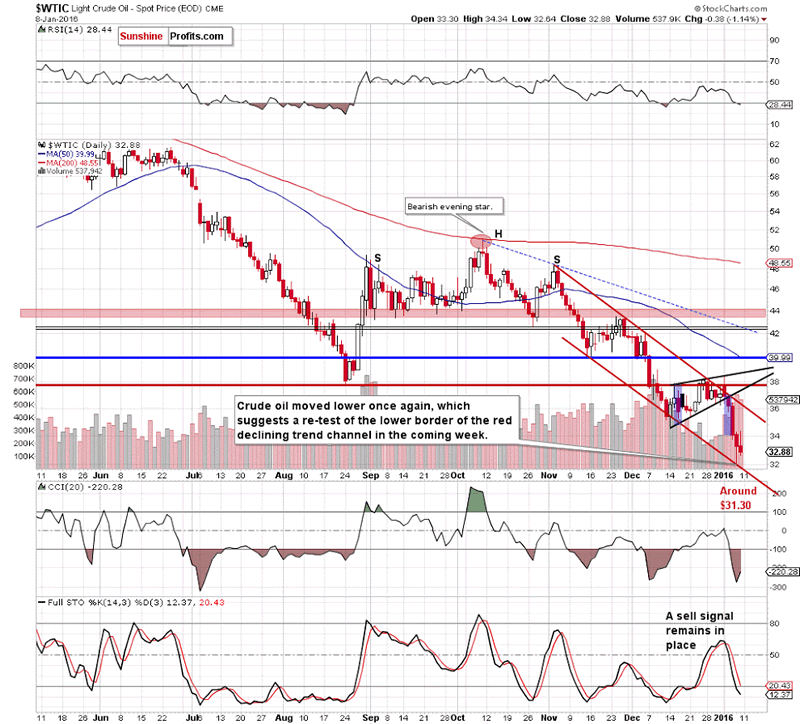
(…) the lower border of the red declining trend channel triggered a rebound in the following hours, but the commodity closed another day under the Dec low. Additionally, sell signal generated by the Stochastic Oscillator remains in place, which in combination with yesterday’s huge volume suggests another attempt to move lower in the coming day(s).
On the daily chart, we see that although crude oil moved sharply higher after the market’s open, oil bulls didn’t manage to push light crude higher. As a result, the commodity reversed and declined below $33, which looks like a verification of the breakdown under the Dec low. If this is the case, such price action is a bearish signal, which suggests further deterioration in the coming week.
If crude oil declines from here, the initial downside target will be around $31.30 where the lower border of the red declining trend channel currently is. At this point, it is also worth noting that the sell signal generated by the Stochastic Oscillator continues to support oil bears and further declines.
How did the last week’s decline affect the long-term picture? Let’s check.
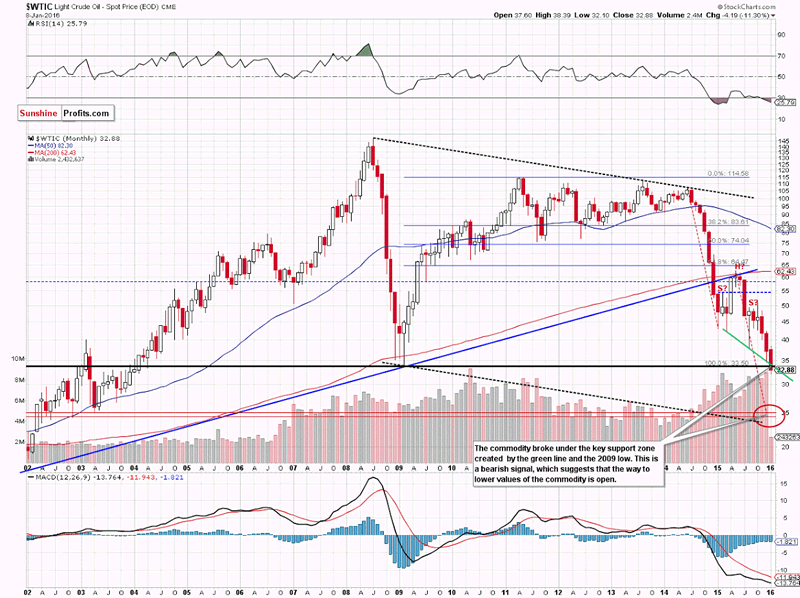
From this perspective, we see that the commodity closed the previous week under the key support zone created by the green line based on previous lows (the neck line of the head and shoulders formation) and the 2009 low. This is a bearish signal, which suggests that the way to lower prices is open. If this is the case, and light crude extends losses, the next downside target would be the psychological barrier of $30.
Summing up, crude oil moved lower once again and closed the week below the 2009 low and the neck line of the head and shoulders formation, which suggests further deterioration in the coming week(s). Therefore, short positions (which are already profitable as we opened them when crude oil was trading around $38) are justified from the risk/reward perspective.
Very short-term outlook: bearish
Short-term outlook: bearish
MT outlook: bearish
LT outlook: mixed with bearish bias
Trading position (short-term; our opinion): Short positions (with a stop-loss order at $39.12 and an initial downside target at $33.66) are justified from the risk/reward perspective.
Nadia Simmons
Forex & Oil Trading Strategist
Przemyslaw Radomski
Founder, Editor-in-chief
Sunshine Profits: Gold & Silver, Forex, Bitcoin, Crude Oil & Stocks
Stay updated: sign up for our free mailing list today
* * * * *
Disclaimer
All essays, research and information found above represent analyses and opinions of Nadia Simmons and Sunshine Profits' associates only. As such, it may prove wrong and be a subject to change without notice. Opinions and analyses were based on data available to authors of respective essays at the time of writing. Although the information provided above is based on careful research and sources that are believed to be accurate, Nadia Simmons and his associates do not guarantee the accuracy or thoroughness of the data or information reported. The opinions published above are neither an offer nor a recommendation to purchase or sell any securities. Nadia Simmons is not a Registered Securities Advisor. By reading Nadia Simmons’ reports you fully agree that he will not be held responsible or liable for any decisions you make regarding any information provided in these reports. Investing, trading and speculation in any financial markets may involve high risk of loss. Nadia Simmons, Sunshine Profits' employees and affiliates as well as members of their families may have a short or long position in any securities, including those mentioned in any of the reports or essays, and may make additional purchases and/or sales of those securities without notice.
© 2005-2022 http://www.MarketOracle.co.uk - The Market Oracle is a FREE Daily Financial Markets Analysis & Forecasting online publication.