


NEW Mathematical Model For Predicting The NEXT US Stock Market Flash Crash
InvestorEducation / Financial Crash Jan 11, 2016 - 07:53 AM GMT

 SUMMARY:
A new mathematical model has been developed that predicts future significant corrections in the US stock market, but in particular it has the potential to predict the next US stock market flash crash.
- In Q4 2015, a new mathematical model was developed with the potential to predict the next US stock market flash crash, prior to the actual event.
- Originally built to calculate strength in price movement in a stock index, the new model can be used to predict significant periods of price weakness.
- Key market corrections, including the recent stock market flash crash events of May 2010 and August 2015 are correctly identified by the model, in advance.
- In addition, key waterfall type corrections, including February 2009, August 2011 and May 2012 are successfully identified by the model, in advance.
- Predictions for 2016 are presented in this article.
INTRODUCTION
A collection of new mathematical models have been developed by the author, over the past ten years, to predict price movement in the US stock market. The models function successfully for stock market indexes, individual stocks, commodities and bond yields. Moreover, the models cover both national and international instances of these indexes and asset classes. Future research will cover additional asset classes not covered here.
Original work led to the identification of market highs and market lows, and also significant stock market tops and bottoms. Since this early work, new models have been built to predict, identify and classify stock market bubbles, and to predict the moment that a bubble bursts and the price drop required to reach a full deflation of a price bubble. More recently, a new model has been developed that predicts significant stock market corrections.
NEW MODEL TO PREDICT MARKET CORRECTIONS
Towards the end of 2015, a new mathematical model was developed to identify price strength in an upward price trend. However, in actual fact the model ended up being an extremely accurate way to predict significant price weakness, during periods where the price strength drops substantially.
Hence, it was possible to analyze market activity, following the recent flash crash of August 2015, and tune the new model to predict stock market corrections and stock market flash crashes (both May 2010 and more recently August 2015).
The chart below for the DJIA (Dow Jones Industrial Average) shows the model output (dates in red) when run from January 1, 2009 to December 2015. The two recent flash crashes are represented by the red circles. The output dates from the mathematical model are generated many weeks prior to the actual events.
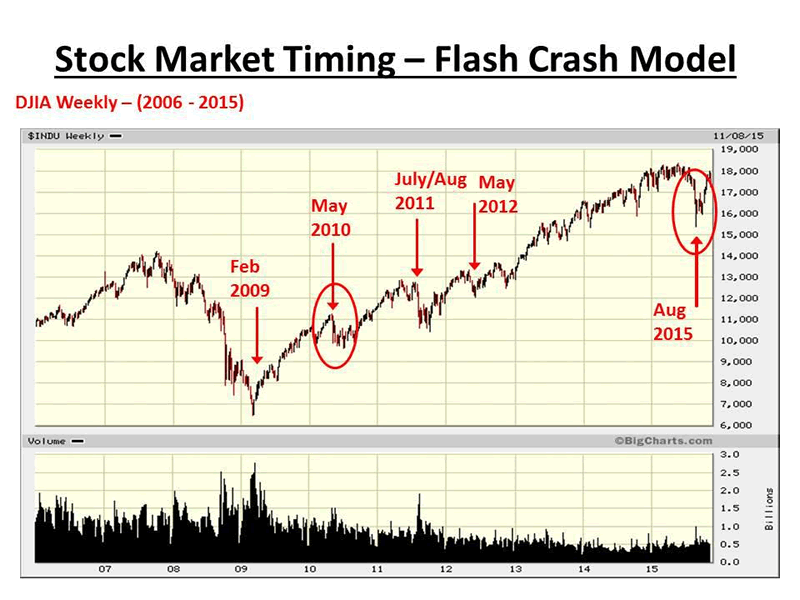
POSSIBLE FACTORS LEADING TO A FLASH CRASH
From the chart above it can be seen that the model identifies significant stock market corrections over time, of which some are more typically referred to as a flash crash. In this case, it is important to identify the major factors that are present in combination with the model signal to turn a serious market correction into a flash crash.
Initially, five factors have been identified as possible contributing factors during the 2010 and 2015 US stock market flash crashes, and these are :-
[1] Price extension caused by Quantitative Easing (QE)
[2] Ending of a QE program
[3] Computerized trading
[4] Low trading volume
[5] An upwards trend
Recently, Goldman Sachs was quoted as stating that there will be more flash crashes in the future. I believe their prediction will hold true, and with each new instance it will be possible to narrow down the possible contributing factors, by discounting those factors that fail to qualify.
At this stage, with data from only two flash crash instances, it is not possible to narrow down the particular factors that are necessary and sufficient to predict a flash crash versus a waterfall event. While the model does have some measure of relative signal strength (whereby a stronger signal is more likely to predict a flash crash) it is not possible, as yet, to determine with great accuracy whether a market event, predicted by the model, is either a flash crash or a significant waterfall event. I believe greater accuracy will come with time.
PRIOR INSTANCES OF PRICE WEAKNESS
If we look more closely at the instances identified by the new model, it is possible to gain a perspective of how much downward price movement is experienced in each case. Usually somewhere between a 10% and a 20% move downwards, however, it can be greater.
The next chart shows the DJIA in the same timeframe as the first chart in this article, however, an additional five model outputs (generated for 2008) have been added to the chart.
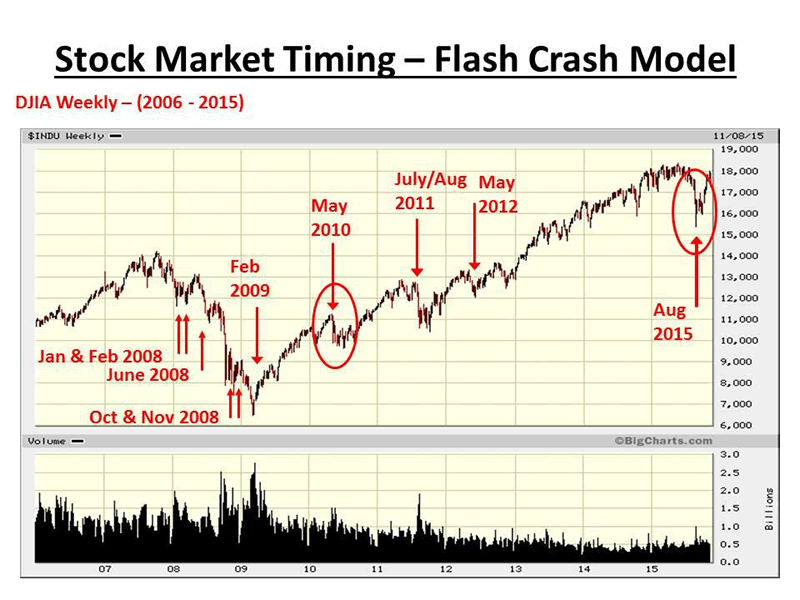
The following daily charts represent the DJIA in each of the cases from the chart above in order to show the price drop for the DJIA at each instance of significant price weakness. Price changes are shown in both total point change and percentage change.
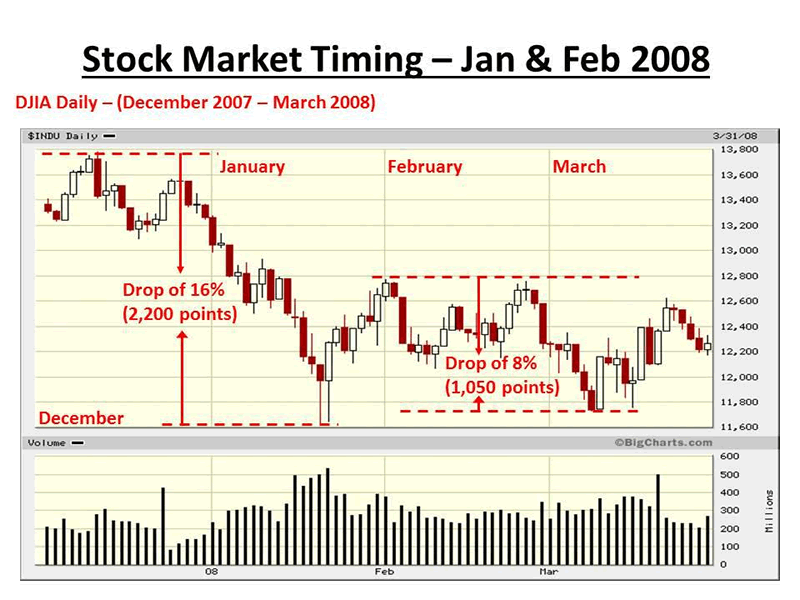
PRICE WEAKNESS JANUARY & FEBRUARY 2008
In early 2008 the DJIA fell 16% from mid December 2007 into late January 2008. A total drop of approximately 2,200 points. A month later, the DJIA fell 8% from the start of February 2008 into early March 2008. A total drop of approximately 1,050 points. The chart below shows these significant price changes.
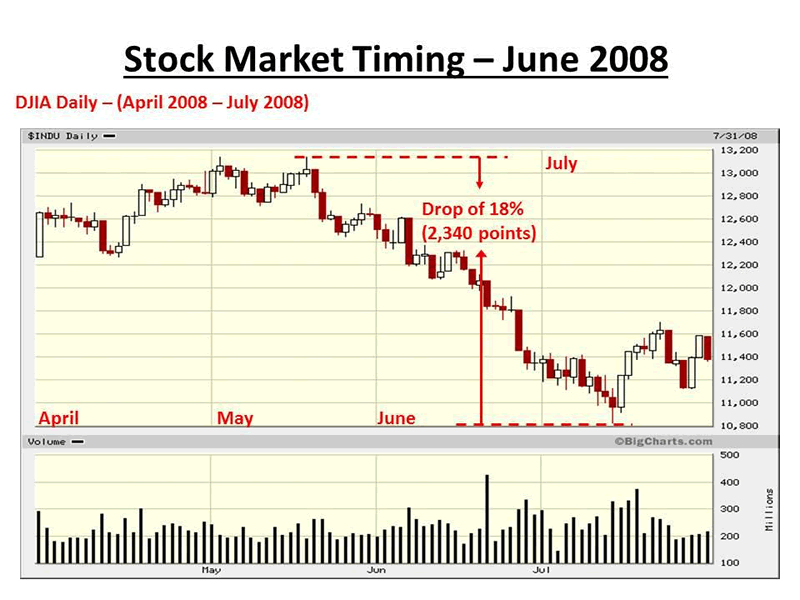
PRICE WEAKNESS JUNE 2008
In mid 2008 the DJIA fell 18% from mid May 2008 into mid July 2008. A total drop of approximately 2,340 points. The chart below shows this significant price change.
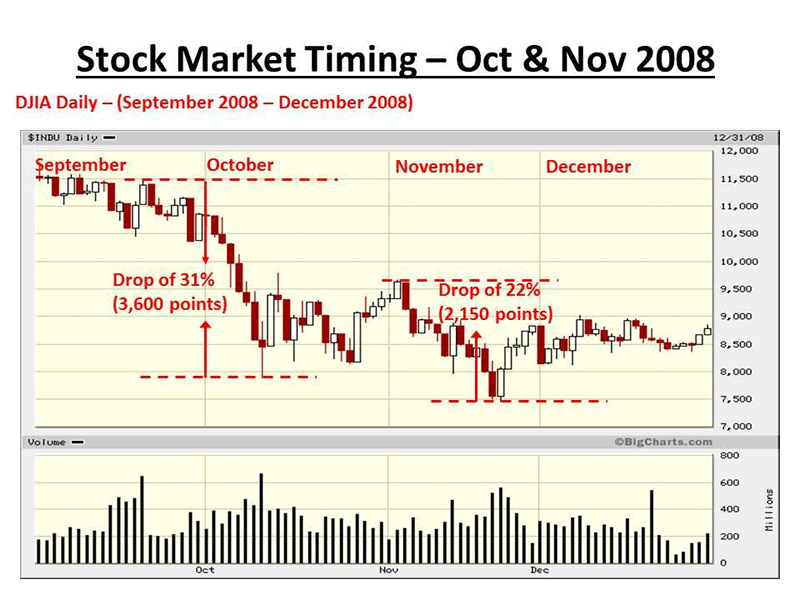
PRICE WEAKNESS OCTOBER & NOVEMBER 2008
In late 2008 the DJIA fell 31% from late September 2008 into mid October 2008. A total drop of approximately 3,600 points. A month later, the DJIA fell 22% from the start of November 2008 into late November 2008. A total drop of approximately 2,150 points. The chart below shows these significant price changes.
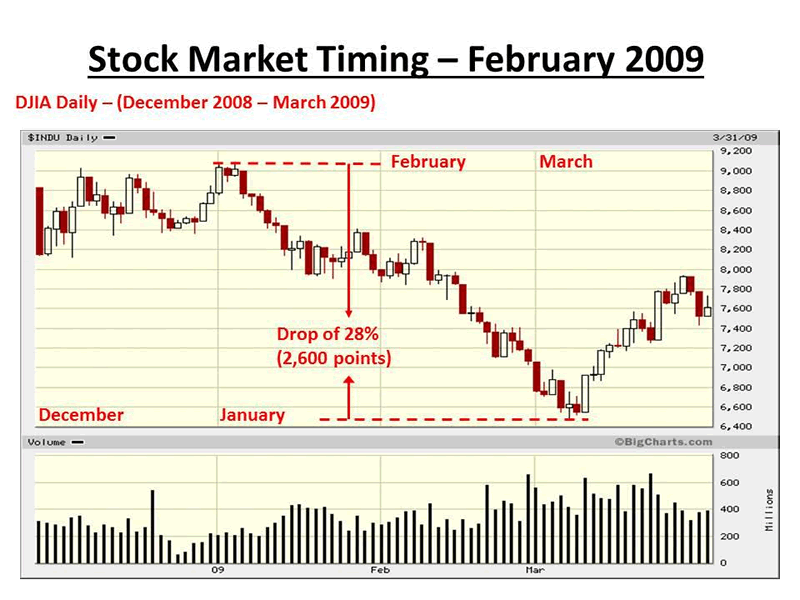
PRICE WEAKNESS FEBRUARY 2009
In early 2009 the DJIA fell 28% from the start of January 2009 into early March 2009. A total drop of approximately 2,600 points. The low on March 9, 2009 was the bottom of the 2007-2009 bear market for the DJIA. The chart below shows this significant price change.
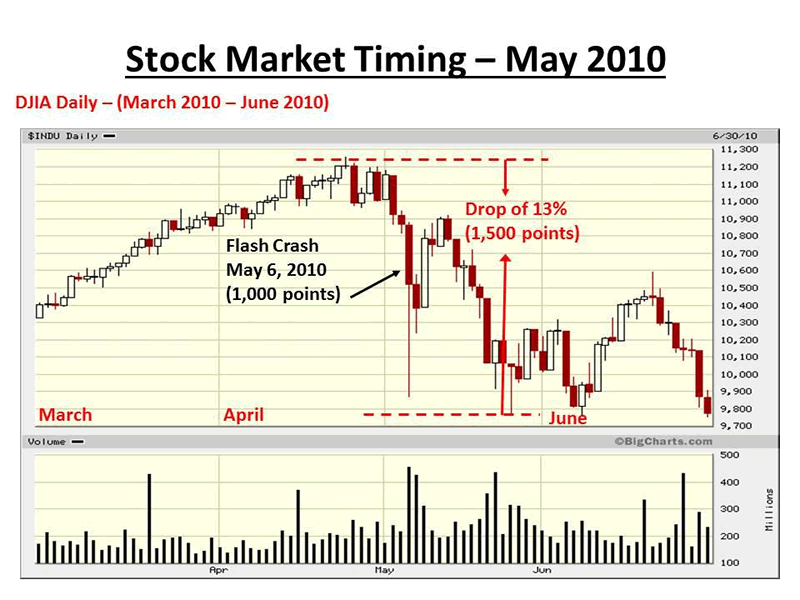
PRICE WEAKNESS MAY 2010
In mid 2010 the DJIA fell 13% from late April 2010 into late May 2010. A total drop of approximately 1,500 points. The May 6th flash crash occurred in the middle of this price drop. The chart below shows this significant price change.
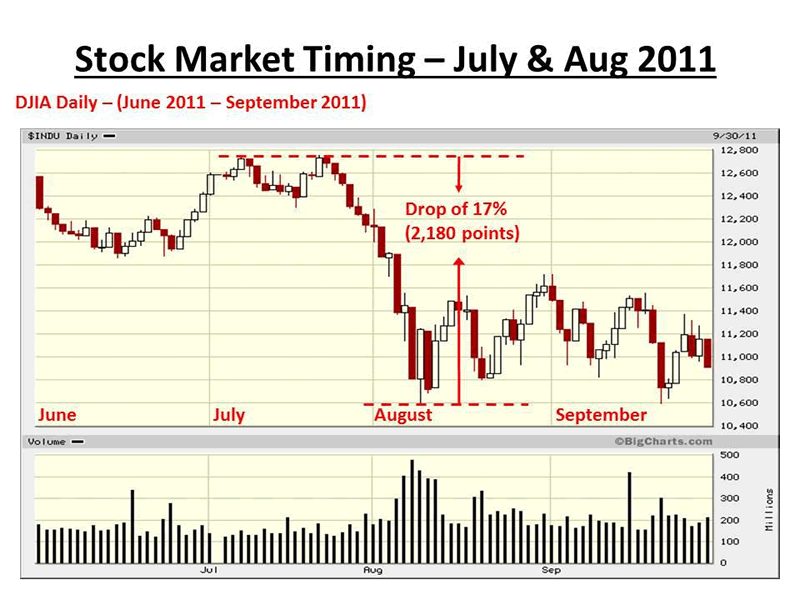
PRICE WEAKNESS JULY / AUGUST 2011
In mid 2011 the DJIA fell 17% from late July 2011 into early August 2011. A total drop of approximately 2,180 points. This downwards move finally bottomed in early October 2011. The chart below shows this significant price change.
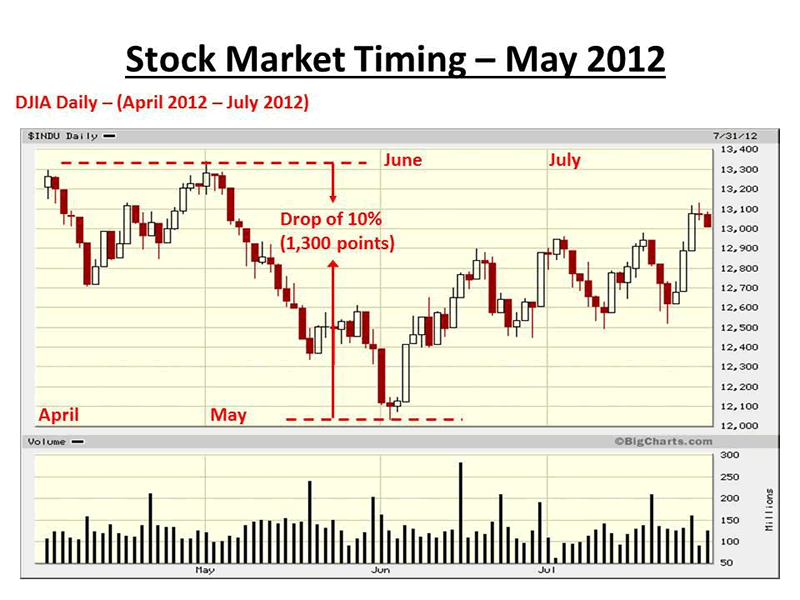
PRICE WEAKNESS MAY 2012
In mid 2012 the DJIA fell 10% from the start of May 2012 into the start of June 2012. A total drop of approximately 1,300 points. The chart below shows this significant price change.
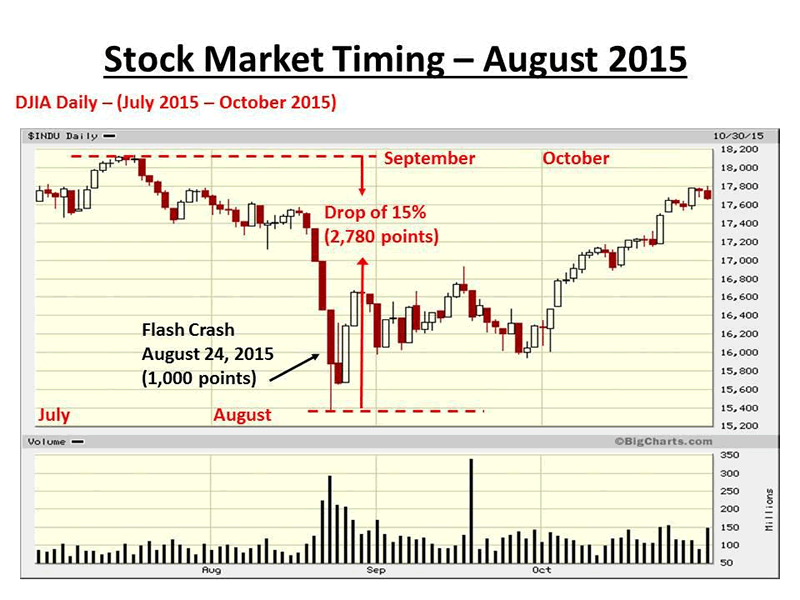
PRICE WEAKNESS AUGUST 2015
Recently, in mid 2015 the DJIA fell 15% from mid July 2015 into late August 2015. A total drop of approximately 2,780 points. The chart below shows this significant price change.
FUTURE INSTANCES OF PRICE WEAKNESS
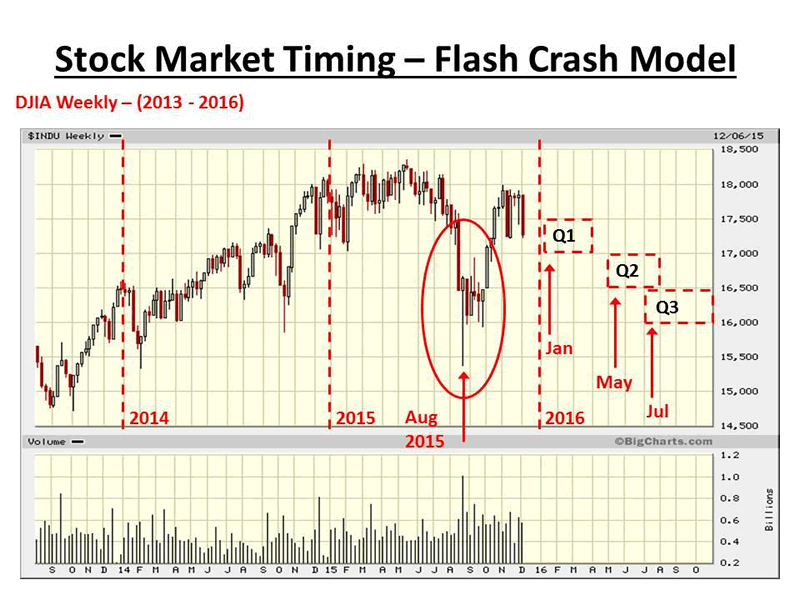
This next section presents the future dates in 2016 that are likely to be instances where we might see significant stock market corrections. The outputs from the model for 2016 are shown in the next chart (presented at the December 17, 2015 meeting of the NYC Investor Meet-Up in Manhattan), where we see January, May and July 2016 as possible future instances.
The dotted red boxes represent a degree of flexibility in which the dates may slide to the right of the chart. For example, if we see price recovery in the DJIA during February, March and April we may see the model change the outputs of May and July by one month to be June and August. Specifically, the model takes new price information into consideration and provides the best prediction possible for future market corrections based upon the newest available price data.
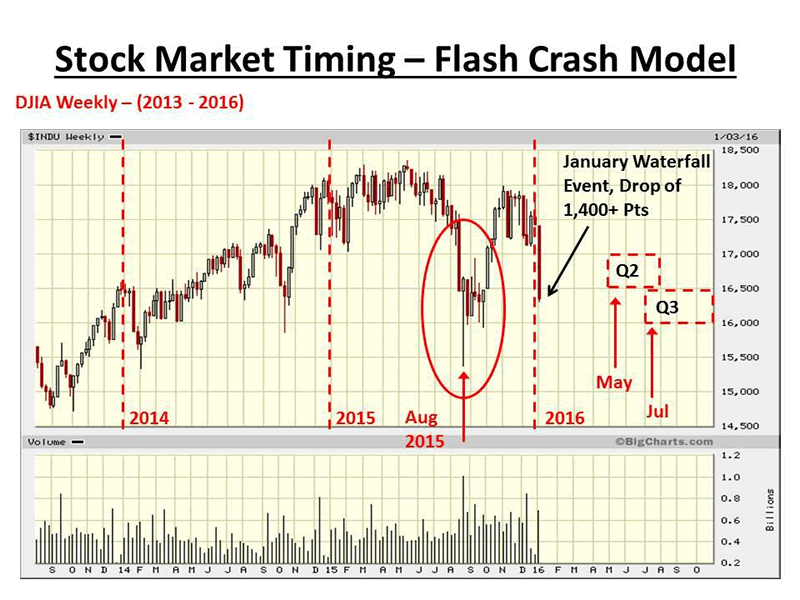
The following chart (at market close on Friday January 8, 2016) shows the drop in the DJIA in just the first five trading days of the new year. This article was written during the first week in January and it can be seen that there has already been a 1,400+ point drop in the DJIA, so the initial prediction for January is already met.
US STOCK MARKET IN 2016 AND BEYOND
A popular saying in the markets is "As goes January, so goes the Year", often called the January effect. Statistically, the chances of an up year for the market are low when the first week of January is down and/or the whole of January is down. So far things do not bode well for the rest of 2016. In addition, the traditional Santa Rally fizzled and eventually failed as we left December and started January.
It is looking increasing likely that the major US stock market indexes have recorded significant lower highs in Q4, 2015 after recording significant new all-time highs (suspected market tops) in Q2 and early Q3, 2015. January 2016 is now starting to look a lot like January 2008, and much of the evidence is pointing to a severe and long lasting downwards move in the US Stock Market.
Currently, the overbought nature of the US stock market is such that a multi-year bear market is required to unwind the indexes from a mathematical point-of-view. Looking at the 130 year history of the DJIA, only one point in time had a similar pattern of extreme price extension and that was 1929 at the start of the Great Depression. In this case, we are looking at a significant fall in the major US indexes before a bottom is reached. The fact that 2016 is not getting off to a good start makes it highly likely that a major bear market started in mid-2015 and will continue until at least late 2017.
Looking at individual US stocks, a significant number of key US companies are in a bubble and their stock price will soon have to deflate 30% to 50% (or more) from all-time highs before the bubbles will have fully deflated. Apple Inc. is one such stock, and with so many companies in the same situation it is very likely that these stocks will bring down the US indexes significantly in 2016. A separate article will be written to cover this topic in detail.
As stock prices fall, investors will head to US treasuries for safety, which will lead to one further and final spike in bond prices and a drop in yields to all-time lows sometime in 2016 or 2017. Then the multi-decade bond rally will probably be over. Only then can the Fed realistically raise interest rates, and not until. Therefore, it could mean continued lower bond yields for some time to come. Investors will also head for Gold and Silver as safe havens, leading to price increases for these metals and eventually, sometime between now and end of 2017, we will see a bottom in Oil followed by higher prices as world demand starts to pick-up relative to the recent increases in world-wide supply.
CONCLUSIONS
At the time of writing this article (first week of January 2016) we have already seen a significant waterfall drop in price in the major US averages. In this case, we have begun to see the advantage of the new model in its ability to predict significant downward movements in price, ahead of time.
If, as I believe, we are now headed into a multi-year bear market much like 2000-2002 and 2007-2009, it will be important to know when key moves downward in price occur. The charts above show that in the period 2007-2009 there were five separate instances identified by the model providing ample warning to traders and investors ahead of time, so that they can act accordingly to protect capital.
Incidentally, the fact that there are three future outputs for the model in 2016 is a hint that there could be a significant move downwards in the US indexes. As a rule, the signals tend to cluster together in bear markets and are much more spaced apart in bull markets.
Regular updates to this article will be provided as the outputs from the model are revised based upon new incoming price data.
By Dr. David J. Harris
Disclosure: The author has no positions in any stocks mentioned, and no plans to initiate any positions within the next 72 hours.
David Harris is an independent stock market investor and trader with an interest in modeling price movements in stock markets. In particular, David has spent the last ten years developing mathematical models to identify market tops and market bottoms and more recently a model that identifies bubbles in national stock market indices and individual stocks. Trained originally as an Electronic Engineer, David has a First Class Honors Degree in Electronic and Electrical Engineering from Leeds University, UK and a PhD in Adaptive Control Algorithms, also from Leeds University. David has worked as a Senior IT Manager in the City of London and more recently in New York City for a variety of Investment Banks, including NatWest ...More Markets, Bankers Trust, Deutsche Bank, Bank of Bermuda and HSBC Bank.
© 2016 Copyright Dr. David J Harris - All Rights Reserved Disclaimer: The above is a matter of opinion provided for general information purposes only and is not intended as investment advice. Information and analysis above are derived from sources and utilising methods believed to be reliable, but we cannot accept responsibility for any losses you may incur as a result of this analysis. Individuals should consult with their personal financial advisors.
© 2005-2022 http://www.MarketOracle.co.uk - The Market Oracle is a FREE Daily Financial Markets Analysis & Forecasting online publication.