


Silver and S&P Stocks Index Similarities – Tops and Bottoms
Stock-Markets / Stock Markets 2016 Jan 08, 2016 - 02:43 PM GMTBy: DeviantInvestor

 Examine the 30 year log scale chart of the S&P 500. What I see:
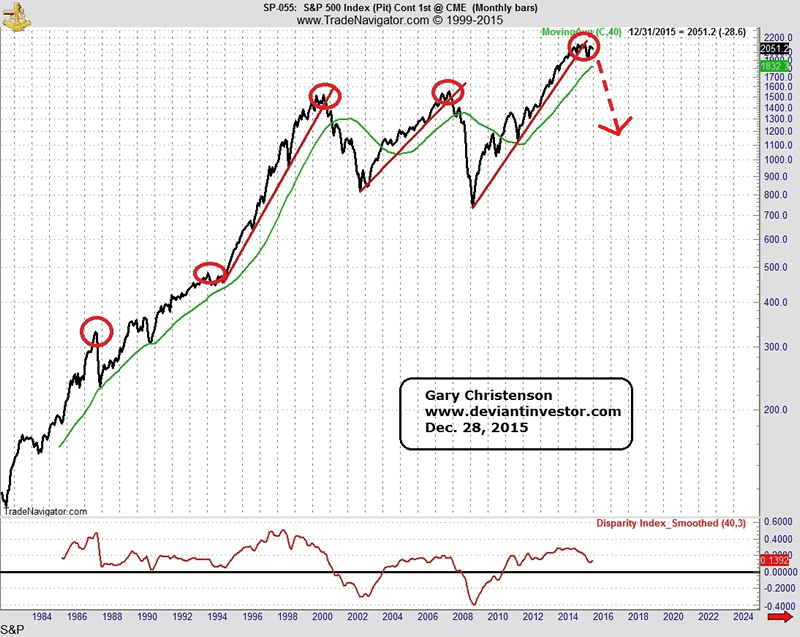
- Tops occurred about every seven years. Tops were usually rounded, followed by intense drops.
- Tops were approximately Aug. 1987, Jan. 1994, March 2000, Oct. 2007, and May 2015.
- Once the S&P broke below the red up-trending support lines in 2000, 2007, and (probably) in 2015, the rally was over and large corrections occurred.
- The next large move in the S&P looks like it should be, based on history, a substantial correction to the 600 – 1,400 range.
Other Considerations:
- Federal Reserve easy money has helped create the last six years of S&P rally. The Fed has been propping up the stock and bond markets while it has been antagonistic to the silver and gold markets.
- Investors, Wall Street, pension funds, and more will scream in anguish if the S&P crashes. The upcoming correction/crash could be worse than the 2008 crash.
- Market breadth, P/E ratios, other fundamentals, crashing commodity prices, and accelerating wars also indicate a likely correction.
- We have been warned, just as we were in 2000 and 2007.
Shorter Term:
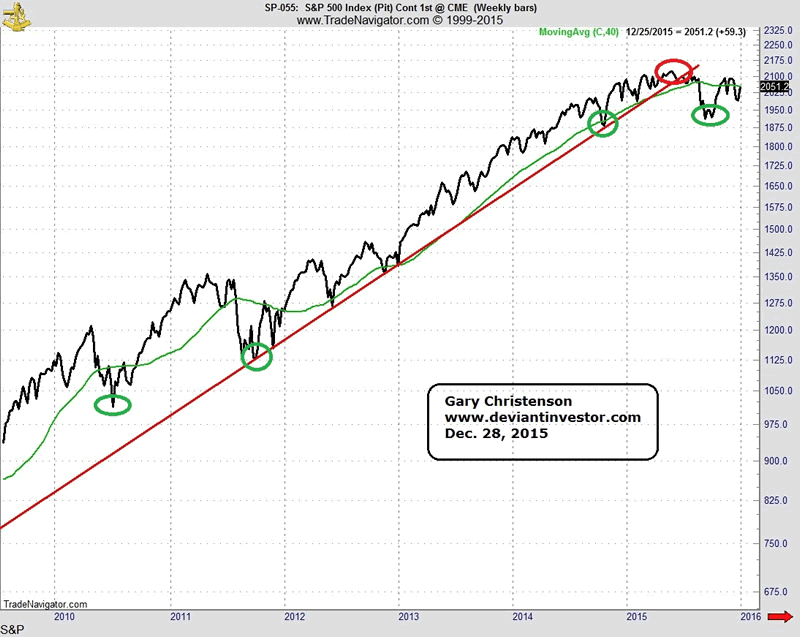
Examine the weekly S&P 500 on a log scale for two periods, 2003 – 2008, and 2010 – 2015. There are similarities.
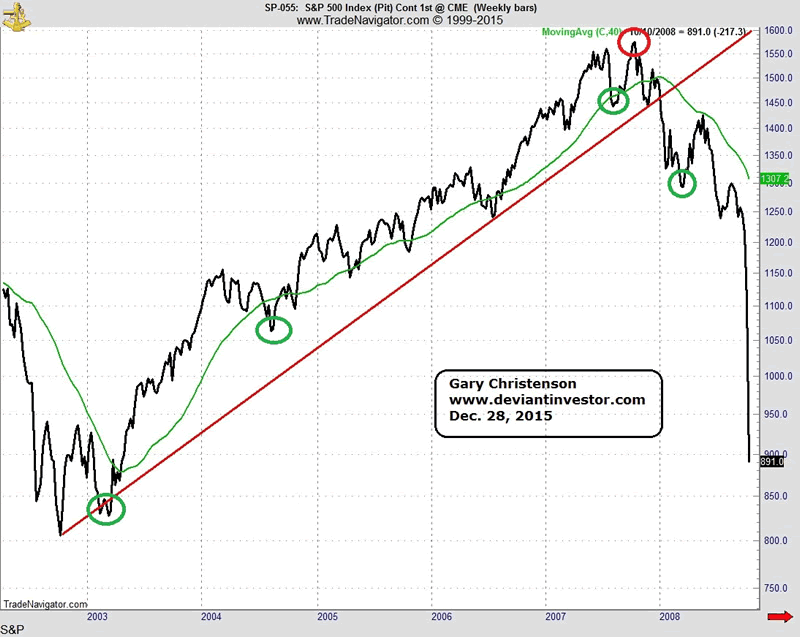
- Significant bottoms: 3/14/03, 8/13/04, 8/17/07, 11/30/07
- Significant bottoms: 7/2/10, 9/23/11, 10/17/14, 8/28/15
- Major top: 10/12/2007
- Major top: 5/22/2015
The bottoms and single top line up fairly well.
Note that five months after the 2007 high the S&P bottomed in March 2008, rallied back into May 2008, and crashed from there.
Three months after the May 2015 high the S&P bottomed in late August 2015, rallied back to November 2015, and — we are waiting to see if a crash occurs in 2016.
WHAT ABOUT SILVER?
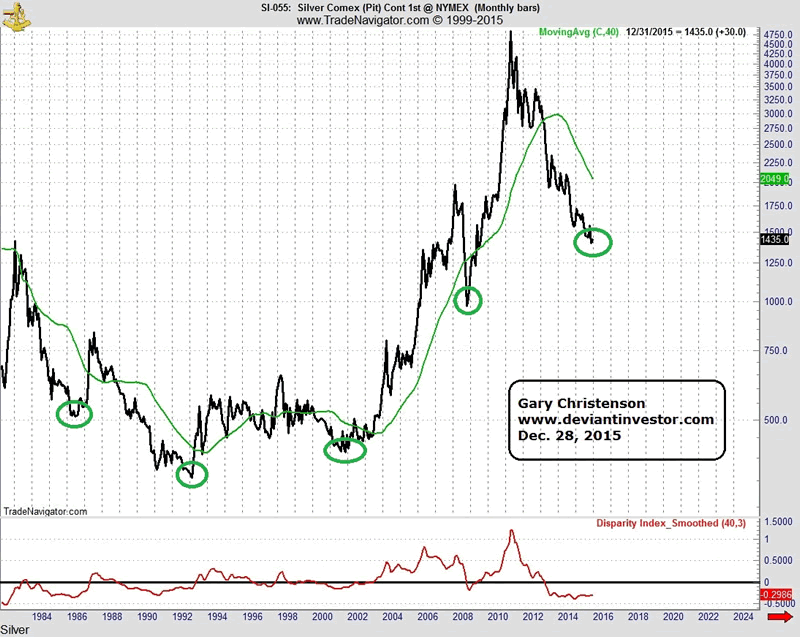
Examine the 30+ year log scale chart of (paper) silver. Note the major lows in silver prices, as indicated.
Silver lows occurred about every seven years in May 1986, February 1993, November 2001, October 2008, and December 2015. Now compare the silver lows to the S&P highs over the past 30 years.
S&P Tops Silver Bottoms
August 1987 May 1986
January 1994 February 1993
March 2000 November 2001
October 2007 October 2008
May 2015 December 2015
Silver and S&P Similarities – Tops and Bottoms
The S&P tops line up moderately well with silver bottoms. The last three S&P tops have preceded silver lows.
WHAT DOES THIS PROVE?
In my opinion this proves very little, but the above certainly SUGGESTS the following:
- The S&P has peaked about every seven years and the peak in May 2015 probably marked the end of this seven year cycle.
- The next big move in the S&P will probably be down, based on cycles, the 30 year charts and the five year charts.
- Silver bottoms occur about every seven years and roughly line up with S&P tops. Assuming the S&P has topped, that supports the expectation for a silver low in December 2015 or perhaps 2016-Q1.
- The next big move in silver should be a substantial, multi-year rally to much higher prices. My 5 – 7 year estimate is $100 per ounce for physical silver.
- Continuing central bank “money printing,” currency devaluations, fiscal and monetary madness, unsustainable debt levels, massive deficits, and accelerating wars suggest higher silver prices.
- In the long term, silver prices increase along with US government official national debt, deficits, and dollar devaluations. Increasing debt, deficits and devaluations are all but guaranteed, and consequently so are long term silver price increases.
- Wars, political stupidity, monetary and fiscal madness, and central bank interventions all seem to be in “bull” markets. Expect silver prices to benefit from all the above.
GE Christenson aka Deviant Investor If you would like to be updated on new blog posts, please subscribe to my RSS Feed or e-mail
© 2016 Copyright Deviant Investor - All Rights Reserved Disclaimer: The above is a matter of opinion provided for general information purposes only and is not intended as investment advice. Information and analysis above are derived from sources and utilising methods believed to be reliable, but we cannot accept responsibility for any losses you may incur as a result of this analysis. Individuals should consult with their personal financial advisors.
Deviant Investor Archive |
© 2005-2022 http://www.MarketOracle.co.uk - The Market Oracle is a FREE Daily Financial Markets Analysis & Forecasting online publication.