


Technical Analysis of the Lumber Commodity Market
Commodities / Lumber Jan 04, 2016 - 11:22 AM GMTBy: EconMatters

 Housing Demand Thesis
The last two years rents have been rising primarily due to supply and demand issues. There hasn`t been enough multifamily housing to keep up with the demand, and as the employment levels go up and more millennials move out of their parent`s house, I expect the housing market to continue to be on the slow but steady upswing of the last several years for 2016.

I think more and more single family homes will have to be built to keep up with the demand as renters for the last couple of years start to want to build equity in real estate versus throwing the money away on rent. And I expect the trend of more multifamily housing projects being built to continue for 2016 as well due to the escalating rents as the population growth has outstripped the conservative building strategies following the housing bubble that led to the financial crash in 2007/08. The builders were just very cautious and financing was subdued to say the least and now there is a lot of catchup going on in the housing sector.
Technical History for 2015
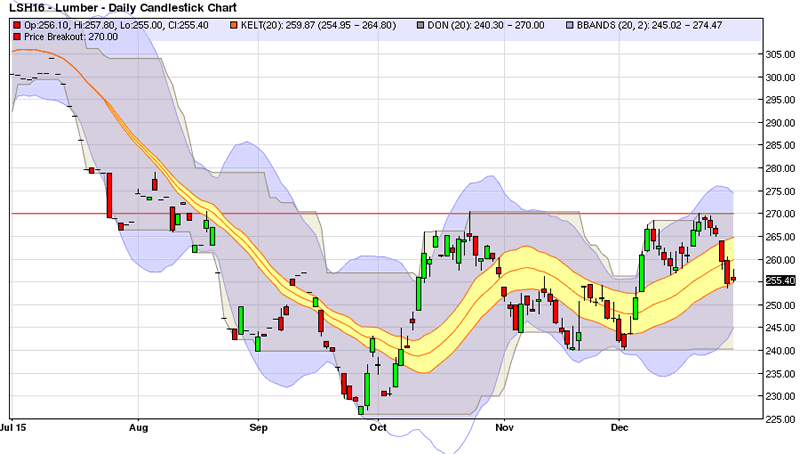
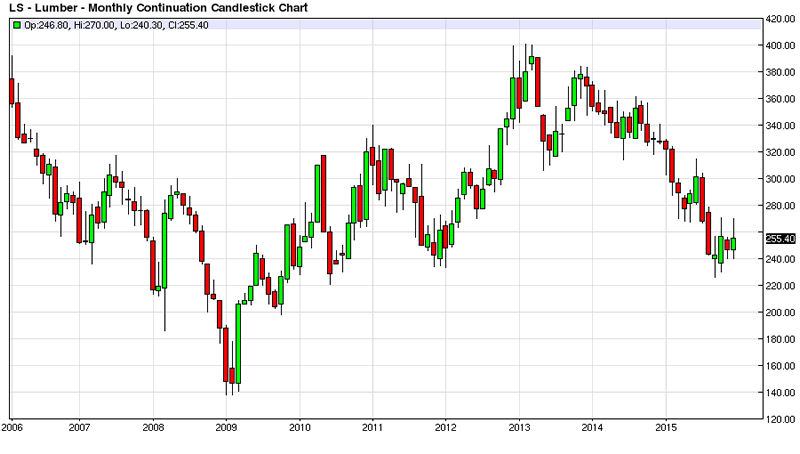
I thought I would take a look at the lumber market as my spider sense tells me that lumber could possibly be a buy here for 2016 and beyond. The March Lumber futures contract is trading at around $255 per mbf on Wednesday as the calendar year of 2015 comes to a close. The Lumber contract reached a low of $226 per mbf in September of 2015 when the rest of the financial market was looking vulnerable during the end of the third quarter selling that picked up steam on China Recession concerns. The Lumber market has been putting in higher lows into year end, and it seems to be setting up nicely for a move higher into 2016.
2016 Technical Levels to Watch
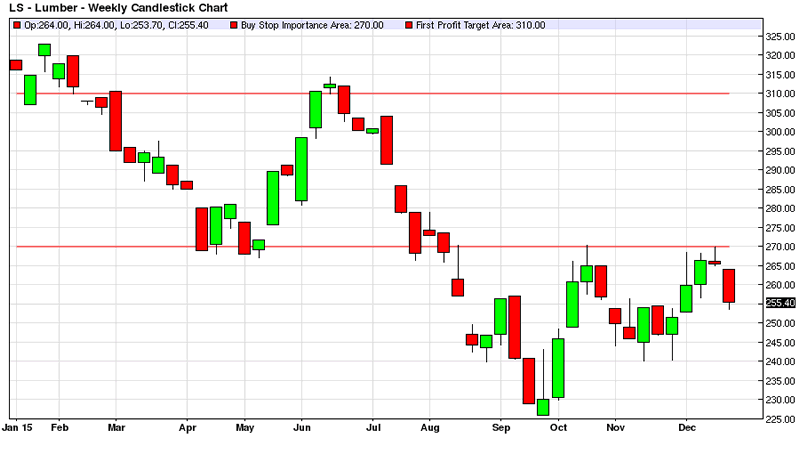
The play is relatively straight forward as there is 4 month overhead resistance at $270 per mbf on the charts and a breakout above this level with a buy stop letting buyers take you into the trade is one way to play this projected rise in lumber prices for 2016. I would put my protective stop at $255 per mbf if I entered on the breakout of the $270 resistance level. My initial target would be $310 per mbf for a 2.67:1 Reward/Risk profile for the trade. I would judge the price action from there and the overall market sentiment with the idea of letting it ride from this initial profit target.
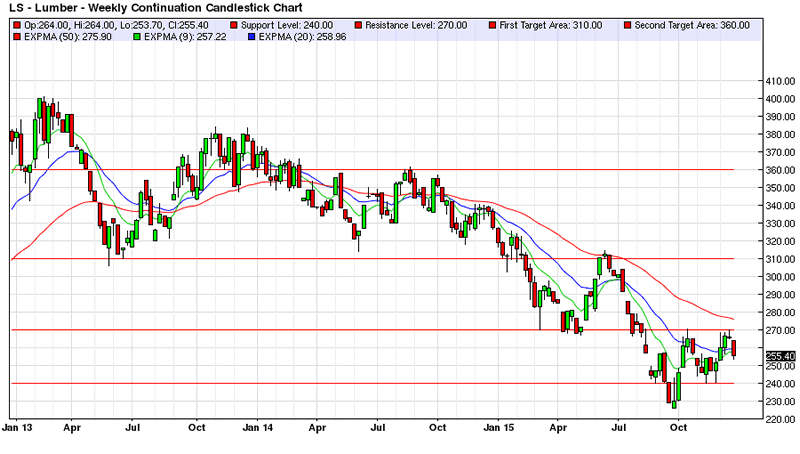
The next area on the two year chart for a profit target to the upside is the $340-$360 per mbf level. If you like to take half off and let the other half ride on the trade then this would be one way to play it by taking half off at the first profit level around $310 per mbf and then taking the second half off at $360 per mbf. One could also break the trade into 3 sections by having 1/3 of the trade riding for a breakout of the $360 level.
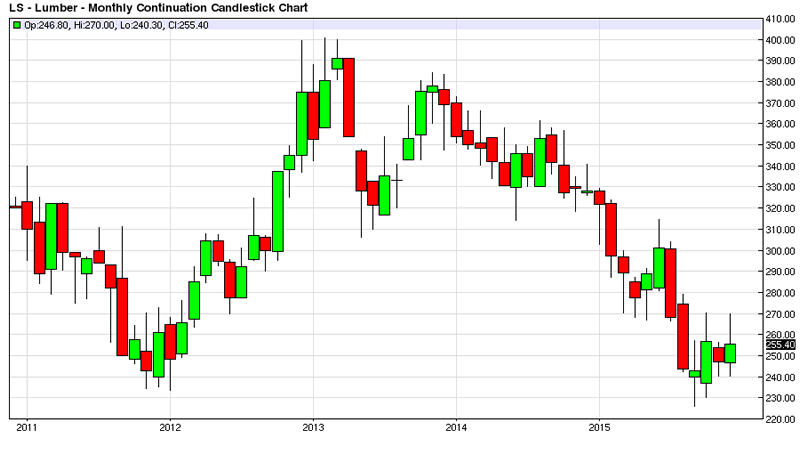
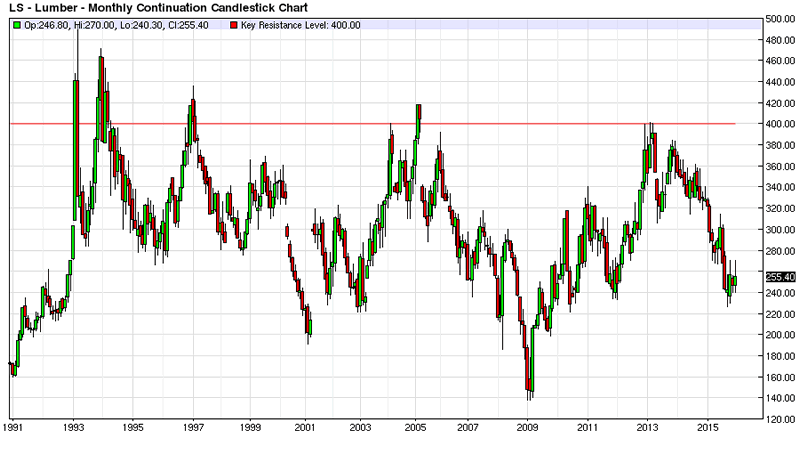
Just for perspective there is 15 year resistance around the $400 per mbf area; but one thing about financial markets is that a trader wants to see how the contract reacts to price at key action levels. Therefore it would be nice to pocket a nice chunk of profits moving your protective stop up in a conservative manner and letting the last 1/3 of the trade prove to you that the trade is done to the upside. If we ever broke $450 per mbf the charts say that $500 per mbf is definitely possible, as back in March 1993 the Lumber futures went as high as $493.50 per mbf.
In Summary
Of course there are a myriad of different trading strategies in how to best take advantage of this possible setup in the Lumber market from an entry and exiting standpoint. I just like to add some trading color to the analysis so that readers can better understand the context of the key technical levels to watch for in the Lumber Futures Market for 2016.
By EconMatters
The theory of quantum mechanics and Einstein’s theory of relativity (E=mc2) have taught us that matter (yin) and energy (yang) are inter-related and interdependent. This interconnectness of all things is the essense of the concept “yin-yang”, and Einstein’s fundamental equation: matter equals energy. The same theories may be applied to equities and commodity markets.
All things within the markets and macro-economy undergo constant change and transformation, and everything is interconnected. That’s why here at Economic Forecasts & Opinions, we focus on identifying the fundamental theories of cause and effect in the markets to help you achieve a great continuum of portfolio yin-yang equilibrium.
That's why, with a team of analysts, we at EconMatters focus on identifying the fundamental theories of cause and effect in the financial markets that matters to your portfolio.
© 2015 Copyright EconMatters - All Rights Reserved Disclaimer: The above is a matter of opinion provided for general information purposes only and is not intended as investment advice. Information and analysis above are derived from sources and utilising methods believed to be reliable, but we cannot accept responsibility for any losses you may incur as a result of this analysis. Individuals should consult with their personal financial advisors.
EconMatters Archive |
© 2005-2022 http://www.MarketOracle.co.uk - The Market Oracle is a FREE Daily Financial Markets Analysis & Forecasting online publication.