Gold and Silver: A Positive Big Picture View of Risk vs. Reward
Commodities / Gold and Silver 2015 Dec 22, 2015 - 07:39 PM GMTBy: Gary_Tanashian
 While routinely following the precious metals as one of many sectors in NFTRH, we have mostly left it alone with respect to public writing over the last few years. That is because it is in a bear market and since I am not a slick short-term trader, I have felt it is best to mostly just let it play out to the bear’s will without overly active involvement.
But several indicators have us on alert that 2016 is going to be the year that the bear ends in gold and gold stocks. So why not publicly discuss the shiny rock a bit more in anticipation? I am still 100% in line with the value aspect of a monetary metal that is historically sought after in times of doubt about the Monetary Politburo’s (Central Bankers’) ability to manipulate the global macro backdrop as desired and to positive effect over the long-term.
A bear market exists to clean out the excess from a previous bull market and though some gold bugs have a hard time admitting it to this day, the sector needed to be cleaned out. It was readily obvious in 2011 when first silver and commodities blew off and blew out, and then gold got driven too high, too fast on Euro Crisis fears and masses of monetary refugees did the “Knee Jerk” into the metal that was supposedly going to save them from the evils of Central Banking gone wrong. Ref our warning: To the Newly Minted Gold Bugs…
“This article will not discuss the obvious contrarian signals that are implied by the public’s entry into the realm of gold, as the barbarous relic is now ‘channel busting’ up, but shows no signs of waning momentum. We will just warn that at some point, momentum always slows and the market in question, always corrects; at some point. For reference, see silver earlier this year.”
I did not predict a bear market. That was confirmed (and well respected) later. But in the summer of 2011, it was obvious that the gold sector was not only due for, but in need of a cleaning. Well folks, that is the good news! We gold bugs have been deep cleaned, buffed, waxed and are just about ready for prime time, hopefully much wiser and more humble than before. The bear market has been a good thing. Period.
I could unleash a chart fest showing gold’s long-term support and downside risk, individual gold stocks that are already in bull markets and myriad other things, but I want to keep this article compact and on message. That message is that a huge proportion of the risk (vs. reward) in gold is now in the rear view mirror with four solid years of bear market activity. So we will show some strategic monthly charts instead.
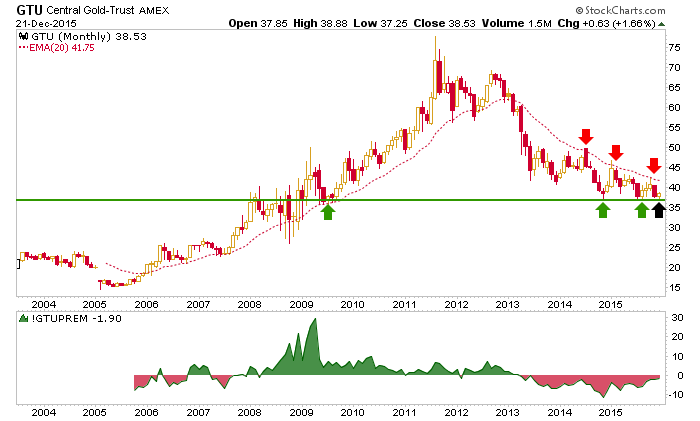
The Central Gold fund’s current discount means that players are risk-averse to gold, almost as if saying “with that juicy 1/4 in interest the Fed just gave us, who needs it?” Yes, it’s sarcasm. We have long held that while confidence in the Fed remains intact, gold will remain on the outs. But long-term investors need big pictures and this is a picture of value, no matter what price does in the near-term.
Gold and Silver together (Central Fund of Canada) represent an even more compelling value case. Silver has been beaten like a rented mule and has led the metals into the depths of despair to the tune of a 10% discount to NAV, where once upon a time silver bugs were confident that a $100/oz. price was just around the corner. Silver now resides at 14.30 an ounce.
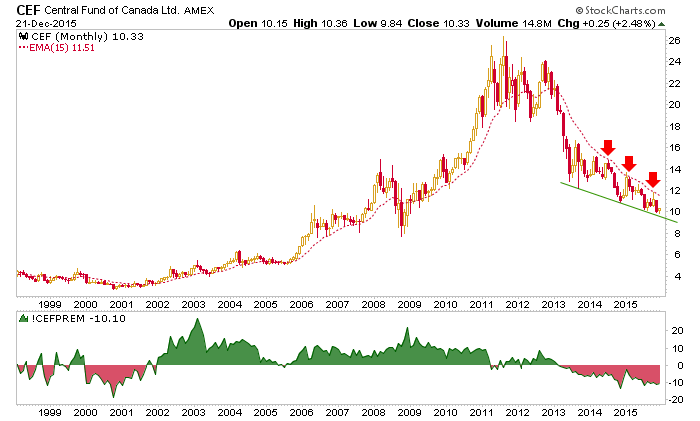
The above charts show value, but they also show that the precious metals remain in technical lock down. That is the stuff that short-term players manage, sometimes obsessively. I am not sure why, because in my opinion the broad markets are much more manageable and since they are generally “in the mirror” to the precious metals, their fate plays into the prospects for the precious metals.
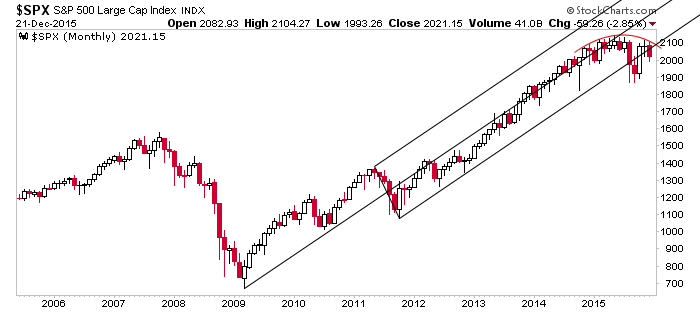
Here is a very simple NFTRH chart of the S&P 500. We routinely cover the US market from many different angles and time frames but again, for this article, let’s keep it really simple. SPX has had a Dome over its head for months now. This has generally been our ultimate parameter between the existing bear case (intact) and a less favored bull case that would see a break above the Dome and a “manic up” phase. So far dear bulls, it ain’t happening.
Since we are on a big picture theme, let’s stick with monthly charts and review another NFTRH chart that is actually just another view of the reset in sentiment that needed to happen on the macro. You remember those “Knee Jerks” running into gold from the Euro Crisis? Here is a picture of any left over US Financial Crisis refugees having completely closed out the fear and angst of 2008-2009. Gold vs. SPX has been sent back to the hell it came from and conventional market participants are back in automatic thinking mode as once upon a time.
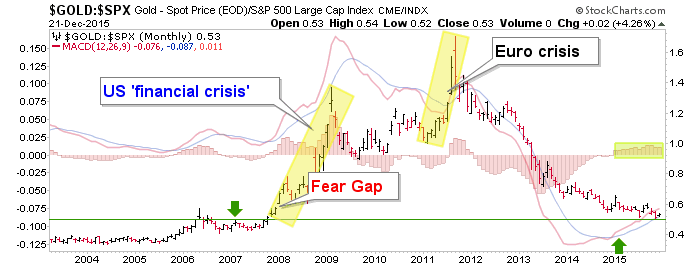
That is exactly where you want them if you are a gold bull in waiting! This is another picture of risk (in US stocks) vs. reward (in gold) that is set up to unfold.
Finally, here is an NFTRH chart that has tried to ‘quant’ an analog of the 2001 bottom in gold stocks (GDM) vs. broad US stocks (SPX). As in 1999-2001, GDM-SPX is on a long decline in relative price but with a monthly MACD positive divergence ongoing. The black dotted lines are when we first started taking note of this analog and we recently updated it with the blue dotted lines.
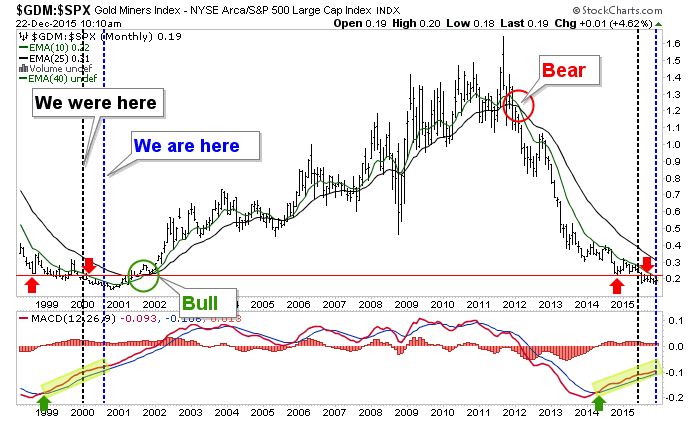
As you can see, relative price is in technical lock down (below resistance with moving averages, nowhere near a bull signal). But if the comparison is anywhere near reliable we are at the point (blue dotted lines) equivalent to late 2000, a few months prior to the bottom. That does not mean the ratio has not already bottomed, it just means that the ‘comp’ did not bottom for good until a couple of months from the equivalent of now.
A bear market cannot end with positive technical signals. Risk vs. Reward in the gold sector vs. the US stock market is now excellent by this measure. But the ratio did not go on to prove it until resistance was exceeded and the moving averages crossed upward. That is why we are now in the realm of positive risk vs. reward but still in a technical bear market.
I want to wish everyone a Merry Christmas and happy holidays of all persuasions and beliefs and a happy, healthy and prosperous New Year. 2016 promises to bring changes, some of which are laid out above in these big picture views. If you would like ongoing, rational analysis in a weekly report and dynamic in-week updates, subscribe now at NFTRH.com before NFTRH gets a modest price increase during the week of January 1st.
Subscribe to NFTRH Premium for your 25-35 page weekly report, interim updates (including Key ETF charts) and NFTRH+ chart and trade ideas or the free eLetter for an introduction to our work. Or simply keep up to date with plenty of public content at NFTRH.com and Biiwii.com.
By Gary Tanashian
© 2015 Copyright Gary Tanashian - All Rights Reserved
Disclaimer: The above is a matter of opinion provided for general information purposes only and is not intended as investment advice. Information and analysis above are derived from sources and utilising methods believed to be reliable, but we cannot accept responsibility for any losses you may incur as a result of this analysis. Individuals should consult with their personal financial advisors.
Gary Tanashian Archive |
© 2005-2022 http://www.MarketOracle.co.uk - The Market Oracle is a FREE Daily Financial Markets Analysis & Forecasting online publication.


