


Gold Price Suspected Bullish Falling Wedge Pattern
Commodities / Gold and Silver 2015 Dec 21, 2015 - 06:56 AM GMTBy: Clive_Maund

 Gold's technical picture is actually little changed from the last update posted on the 6th, apart from its having made marginal new lows late last week. What has changed is that we have since seen the Fed raise interest rates for the first time in many years, and the Junk Bond market has started to seriously fall apart.
With respect to the rise in interest rates there are two points to be made. The first is that, contrary to the general belief that gold is less attractive in an environment of rising rates because it doesn't pay interest, it actually does well, because some of the money that floods out of the stockmarket flows into gold. Second, the Fed's diminutive rate rise was a hollow face-saving measure, intended to salvage some credibility after it had been "crying wolf" for so long. It is too little and far too late.
The time to raise rates is when the economy is strengthening and beginning a new growth cycle - what has happened here is that they are trying to raise rates at a time when an artificially induced recovery brought about by a tidal wave of money printing is already spluttering and running out of steam. The Fed, having been progressively cornered by their past misdeeds and gross excesses, are desperately trying to demonstrate that they are still in control when they no longer are. The market has got the ball now and will show them who's boss by crashing the Junk Bond market, which is already happening, starving the stockmarket of buyback funds so that it collapses, with the result that the Fed has to make a groveling about face into NIRP and then embark on its final act of reckless abandon, QE4, at which point gold will take off like a rocket. So it is by no means guaranteed that the dollar will embark on another major upleg - if the market figures out that this is going to happen, the dollar could top out here.
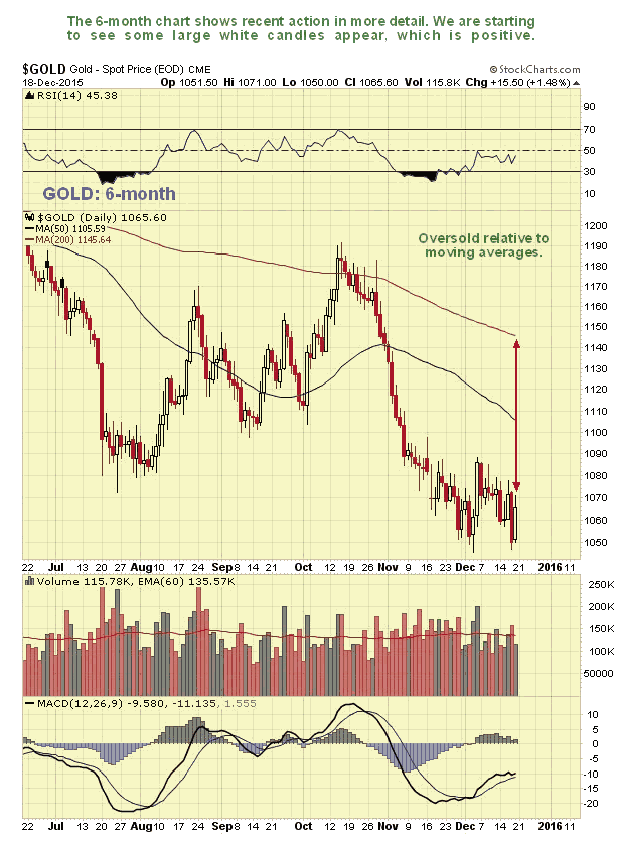
Looking now at the charts, we will start with the 6-month chart which shows recent action in detail. On it we can see more clearly the new closing low on Thursday, and how some larger white candles are starting to appear on the chart, which is a positive.
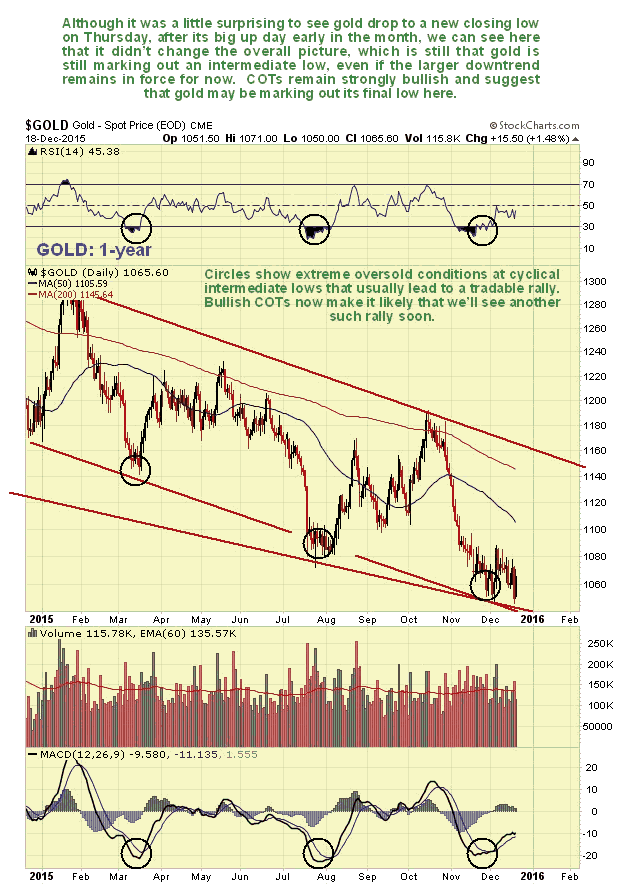
On the 1-year chart for gold we can see that although it made a new closing low late last week, it was not by much, and it didn't change the overall picture, which is that gold looks like it is marking out an intermediate cyclical low here that should lead at the least to a tradable rally, even if it doesn't succeed in breaking out of the downtrend shown.
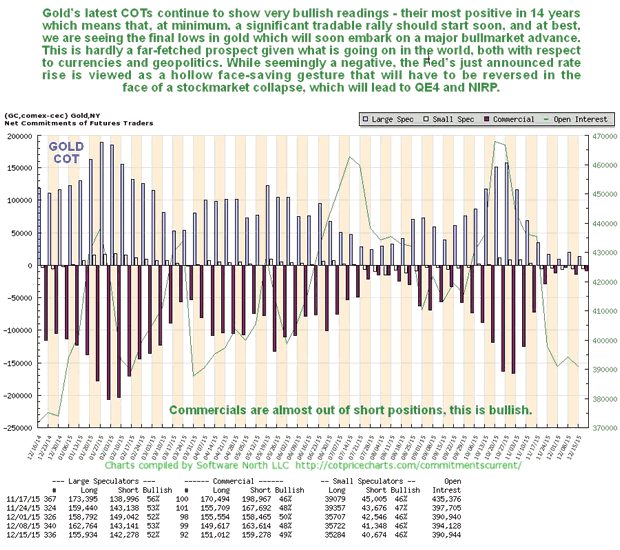
The latest COTs show the Commercials having largely eliminated their short positions, which are at their lowest level for about 14 years. This is construed as being very bullish indeed, and suggests that gold will soon do more than merely embark on an intermediate rally - we may have just seen the final low. If so, it does not bode well for the dollar, which implies that the Fed will soon have its back to the wall after its latest bit of theater.
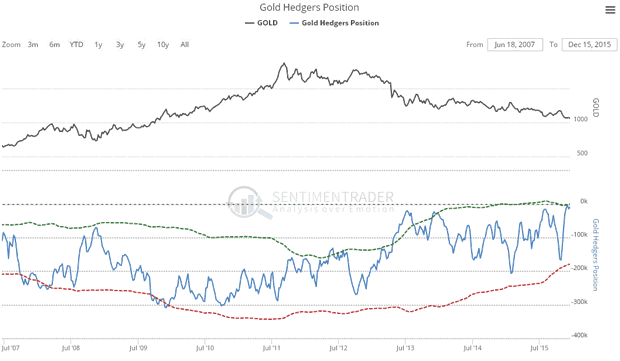
The Hedgers chart, which is a form of COT chart, looks more positive than for many years. This certainly bodes well for gold.
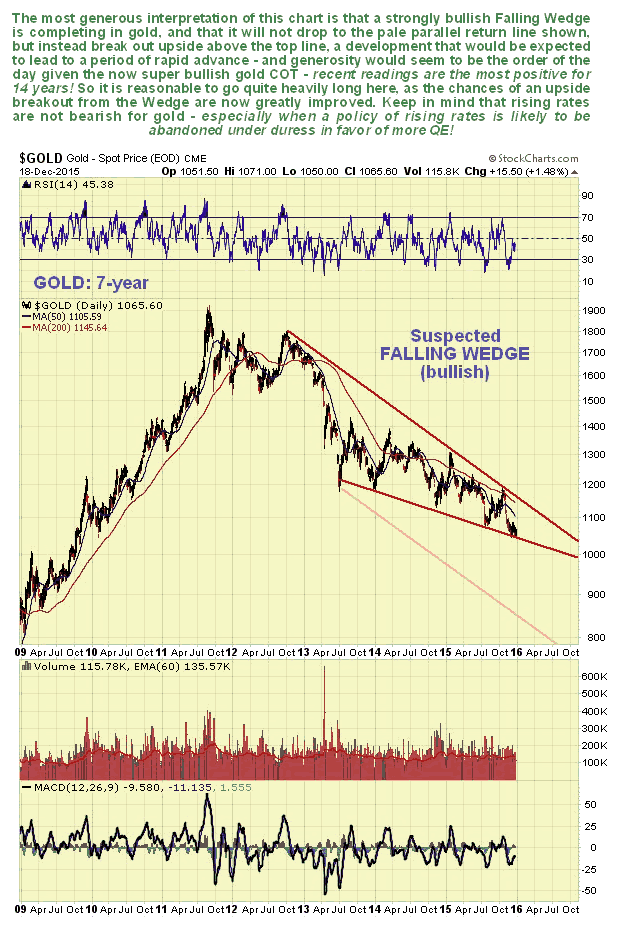
Of crucial importance on the 7-year chart for gold is whether the converging channel shown is valid, because if it is then it is a quite strongly converging bullish Falling Wedge, and as it is now closing up, an upside breakout should occur soon. Factors suggesting that this channel is indeed valid are firstly the number of times it has risen off the lower boundary, which is four now, and the now strongly bullish COT, which is thought to all but preclude a more serious decline to the lower parallel pale red channel boundary, even though this could theoretically happen in a market crash situation. However, in this scenario, it seems likely that will gold will go counter-cyclical, in contrast to what happened in 2008, one reason being that the PM sector has already been smashed, and another being that this time round bonds are in trouble with the prospect of widespread Sovereign defaults.
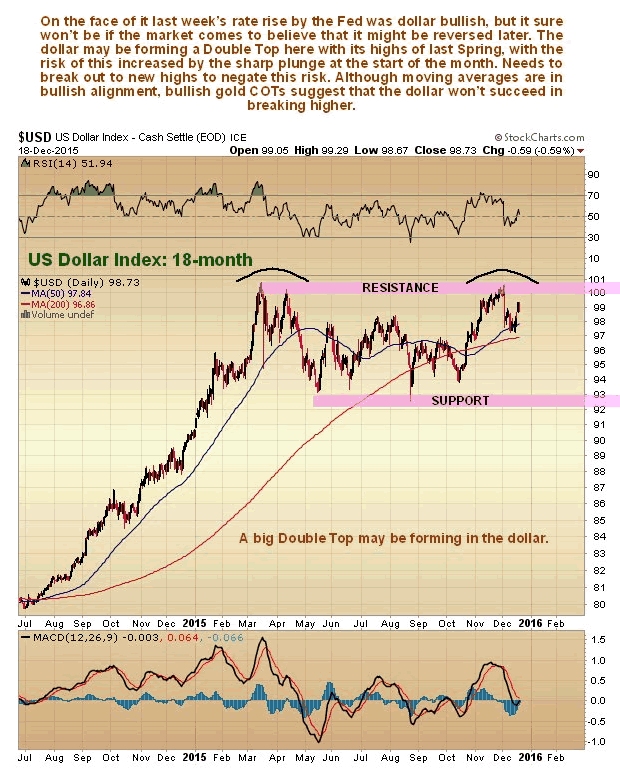
Now we will turn our attention to the dollar. On the 18-month chart for the dollar index we can see that late last month it tried - and failed - to break out to new highs. This was followed by a very sharp reversal, but last Thursday the dollar was emboldened to rally by the Fed raising interest rates for the first time in many years, albeit by a trifling amount. If the Fed follows through with its proposed rate rises over the next year, then it is logical to suppose that the dollar will break out to new highs and advance, but if the Fed is faced down by the markets and "has its nose well and truly pushed in it" as we have deduced above, and is forced to backtrack into NIRP and QE4, which looks very likely, then as soon as the market figures out that this is the likely outcome, the dollar should start to crumble, as the carrot of further rate rises disappears like a mirage on a Kuwait City freeway.
Finally, the government knows that the population is getting increasingly angry and restive, as its standard of living is steadily eroded due to the deepening depression caused by excess debt, and it has already lined up an external scapegoat in the form of Russia, towards which the public will be encouraged to direct their anger. The drive to war with Russia and perhaps other countries allied with it, either directly or more likely through proxies, will also be seen as desirable as a way to stimulate the economy and further enrich the defense industry who wield immense power over politicians. This is potentially a very dangerous situation that could easily get out of hand, as happened in the late thirties. This geopolitical dimension is likely to be another important driver for the looming new bullmarket phase in gold.
By Clive Maund
CliveMaund.com
For billing & subscription questions: subscriptions@clivemaund.com
© 2015 Clive Maund - The above represents the opinion and analysis of Mr. Maund, based on data available to him, at the time of writing. Mr. Maunds opinions are his own, and are not a recommendation or an offer to buy or sell securities. No responsibility can be accepted for losses that may result as a consequence of trading on the basis of this analysis.
Mr. Maund is an independent analyst who receives no compensation of any kind from any groups, individuals or corporations mentioned in his reports. As trading and investing in any financial markets may involve serious risk of loss, Mr. Maund recommends that you consult with a qualified investment advisor, one licensed by appropriate regulatory agencies in your legal jurisdiction and do your own due diligence and research when making any kind of a transaction with financial ramifications.
Clive Maund Archive |
© 2005-2022 http://www.MarketOracle.co.uk - The Market Oracle is a FREE Daily Financial Markets Analysis & Forecasting online publication.