EURUSD Final Bear Rally Leg Underway
Currencies / US Dollar Dec 10, 2015 - 10:52 AM GMTBy: Austin_Galt
 Price recently traded down to support outlined in previous analysis before reversing and trading higher in impulsive style. While a turn back up was expected in order for the bear rally to embark on the final leg higher, this move was on the back of the ECB announcement.
There is always a reason for a move and the market does indeed work in mysterious ways. Some will say this was just a lucky coincidence and I must admit I don't truly understand it. However, what I do understand is that I have seen this type of stuff happen on too many occasions for it to be just a coincidence.
Let's review the daily chart to see where things currently stand.
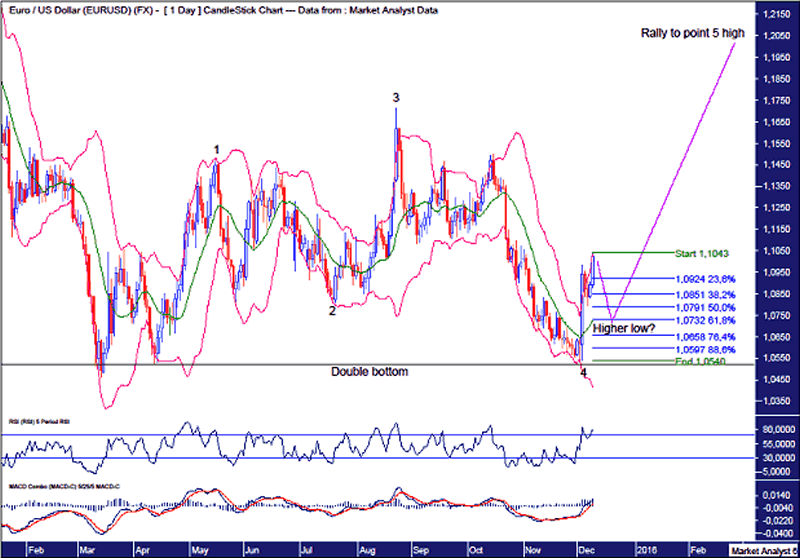
EURUSD Daily Chart

We can see the recent low set up a double bottom with the previous swing low at 1.0521. This is a bullish double bottom as it occurred at a higher level than the previous low which was at 1.0462.
Also, this low is the point 4 low in a 5 point broadening top formation. That means price has now set sail on the final leg of this bear rally that has been in force since the March 2015 low and is set to terminate in a point 5 high.
Today price has traded above last week's high and while price could continue higher from here I favour a pullback to put in a more significant higher low.
I have added Bollinger Bands and I favour the higher low to be around the middle band which currently stands around the 1.0720 mark.
I have added Fibonacci retracement levels of the move up and I would like to see price pull back to at least the 61.8% level which stands at 1.0732. Let's see.
The RSI made a new high on last week's bullish move and today's price high at 1.1043 sets up a little bearish divergence.
The MACD is bullish although the averages have diverged somewhat and price pulling back now would just help to bring them close together before price resumes higher once again.
Summing up, price has now begun the final leg of the corrective phase which I expect to be quite swift and by the time it is done many will start to think a new bull trend is in play. As outlined in previous analysis, I expect this bullish sentiment to reach its peak once price gets up to around the 1.26 area.
By Austin Galt
Austin Galt is The Voodoo Analyst. I have studied charts for over 20 years and am currently a private trader. Several years ago I worked as a licensed advisor with a well known Australian stock broker. While there was an abundance of fundamental analysts, there seemed to be a dearth of technical analysts. My aim here is to provide my view of technical analysis that is both intriguing and misunderstood by many. I like to refer to it as the black magic of stock market analysis.
Email - info@thevoodooanalyst.com
© 2015 Copyright The Voodoo Analyst - All Rights Reserved
Disclaimer: The above is a matter of opinion provided for general information purposes only and is not intended as investment advice. Information and analysis above are derived from sources and utilising methods believed to be reliable, but we cannot accept responsibility for any losses you may incur as a result of this analysis. Individuals should consult with their personal financial advisors.
Austin Galt Archive |
© 2005-2022 http://www.MarketOracle.co.uk - The Market Oracle is a FREE Daily Financial Markets Analysis & Forecasting online publication.


