Stock Market Rally Losing Momentum?
Stock-Markets / Stock Markets 2015 Nov 23, 2015 - 03:55 AM GMTBy: Andre_Gratian
 Current Position of the Market
SPX: Long-term trend - Bull Market
Intermediate trend - SPX has resumed its uptrend in order to complete the last phase of the bull market.
Analysis of the short-term trend is done on a daily basis with the help of hourly charts. It is an important adjunct to the analysis of daily and weekly charts which discuss longer market trends.
RALLY LOSING MOMENTUM?
Market Overview
Last Monday SPX started to rally from the very opening, continued to move up during the whole week, and closed on Friday about 70 points higher. However, during the last two days, it ran into some resistance and experienced some deceleration, only tacking on another 6 points. If it can't recover its upside momentum on Monday, it could start a correction, although the short-term projection calls for a few extra points.
The uptrend from 1872 ended slightly above the lower intermediate channel line and was, for all intents and purposes, a back-test of that channel line. A .382 retracement ensued down to about 2020 and, by Friday, we had moved back a few points below that same resistance level. The index may require more consolidation before it can rally a little higher and complete the final phase of the bull market. The short term requires some clarification, especially with some negative divergence beginning to develop at the daily and hourly levels. By the end of next week we should have a much better idea of where we are in this "purported" final phase of the bull market.
Intermediate Indicators Survey
After going flat for one week, the weekly MACD has resumed its uptrend and is about to become positive. The SRSI has also turned back up
The NYSI (courtesy of StockCharts.com) barely stopped declining last week as the McClellan Oscillator moved back from negative to slightly positive. This week, they are both pointing a little higher before the current rally takes a breather.
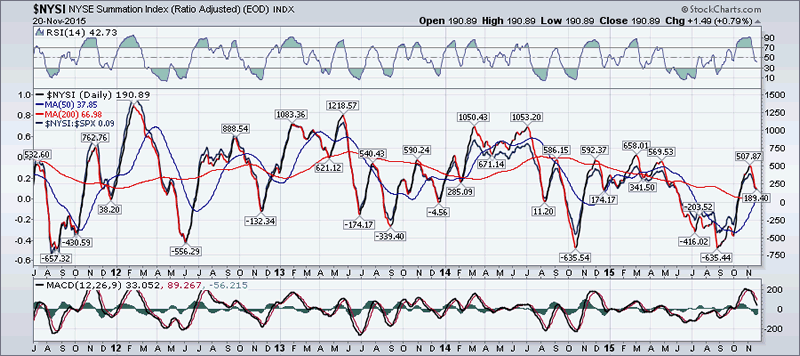
(Both 3X and 1X P&F charts point to the current level for a low.)
Chart Analysis
Daily SPX chart (courtesy of QCharts.com, as well as others below).
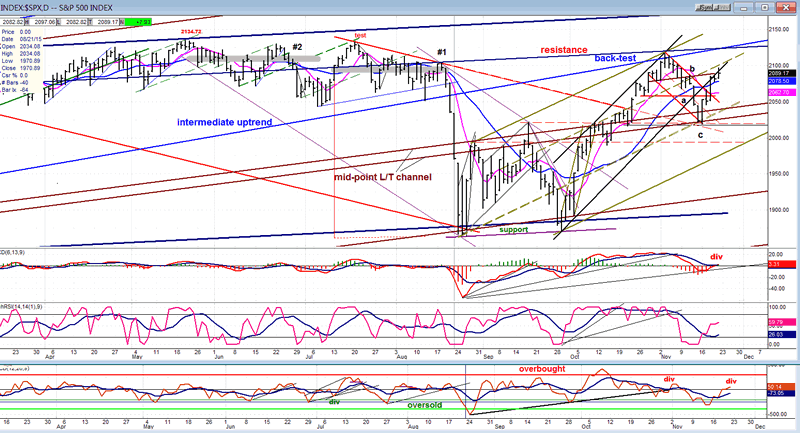
SPX has exited the black channel and has exchanged it for a much broader green channel. Prices found resistance at the top of the black channel, a level which coincided with the bottom of the blue intermediate channel. After back-testing the bottom line of the blue channel, it pulled back exactly .382 of its uptrend from 1872, an area of strong support which was discussed in last week's letter. This took it outside of the black channel. Now, it is in the process of back-testing the broken black channel line which may be one of the reasons why it seems to be having difficulty moving decisively higher.
The entire trend from the August low of 1867 is now contained in the larger, green channel which appears to have divided itself into three portions instead of the more normal, two. After finding support at the one-third trend line (from the channel bottom), the index has rebounded to the two-thirds line which, along with the bottom line of the black channel, could create enough resistance to stop the move. The inability of the index to move above that two-thirds line would be considered price deceleration within the green channel, and a warning that another correction may be imminent. The total rally from 1867 -- which is ostensibly the last phase of the bull market -- will come to an end when the lower green channel line is broken. This will be a warning to prepare ourselves for a potential major decline.
In addition, some negative divergence has begun to appear in the indicators. In spite of the rally, the MACD has still not made a bullish cross of its moving averages. The A/D oscillator is also sub-par, having barely risen above the 50% line. Those are not positive signs for the index, but I don't want to jump to conclusions until I see next week's action.
Hourly SPX chart.
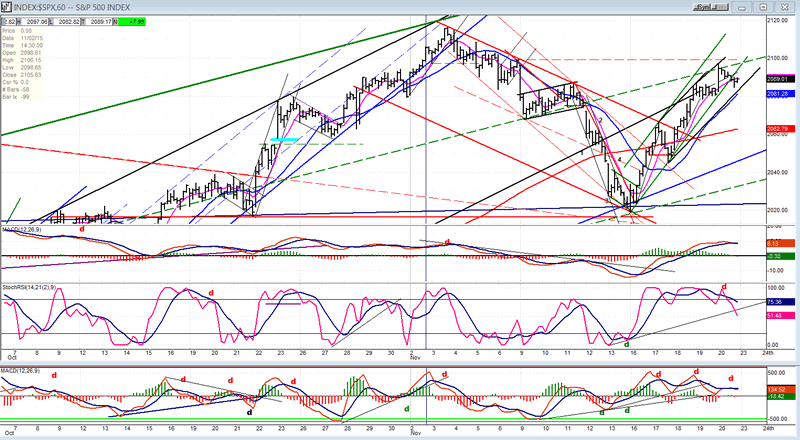
The loss of momentum is obvious on the hourly chart. The narrow green channel is representative of the trend from the 2020 low and, on Friday, after being unable to reach the top of the channel, the index actually closed outside of it. One can still make a case that the short-term trend has merely shifted to a less steep angle of ascent; but if the price drops below the blue moving average, it could turn the trend down to at leastform additional consolidation before attempting to make a new high.
The hourly indicators have already rolled over after showing some negative divergence. If this causes prices to pull-back right away, enough of a retracement could turn down the daily indicators, causing more pronounced weakness to take hold which could even threaten the bottom line of the green channel.
Reversing from here could also alter the evolving structure which, until now, has the appearance of an impulse wave. Pulling back below 2066 would cause an overlap which will nullify the impulse wave and again revive some doubt about the ability of the index to make a new high before completing the final bull market phase.
XBD (American Securities Broker/Dealer) and more
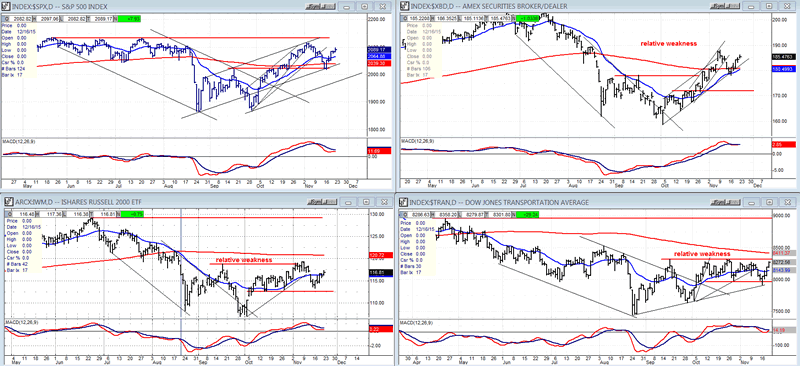
Looking at the performance of these four indexes, we can see why next week will be such an important time frame. The IWM continues to underperform the SPX, but the transportation index may be ready to break out of its consolidation pattern and play catch up with SPX. That could alter our perception of what the market is doing. XBD is moving along with the main index right now, but it retains an overall relative weakness.
UUP (dollar ETF)
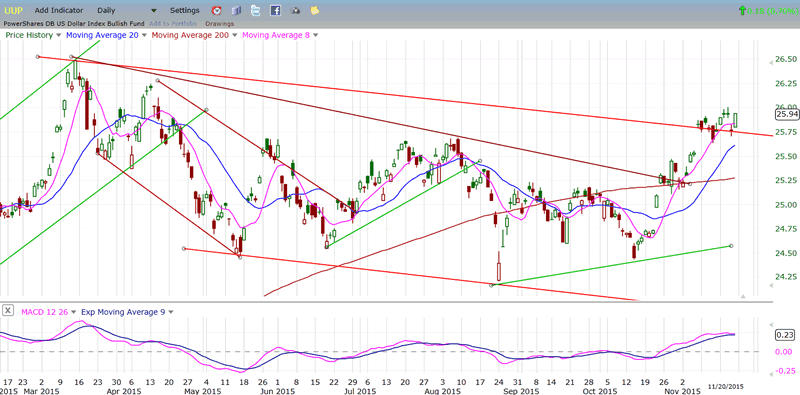
After breaking its intermediate downtrend line, UUP raced up to the top of its corrective channel line and rose slightly above it. It has spent a few days consolidating its advance, but may be ready to resume its climb with the goal of challenging its March high. Getting there could generate some additional consolidation which is likely to be only temporary. It has higher P&F projections which will probably require several more weeks of uptrend to reach.
GLD (Gold trust)
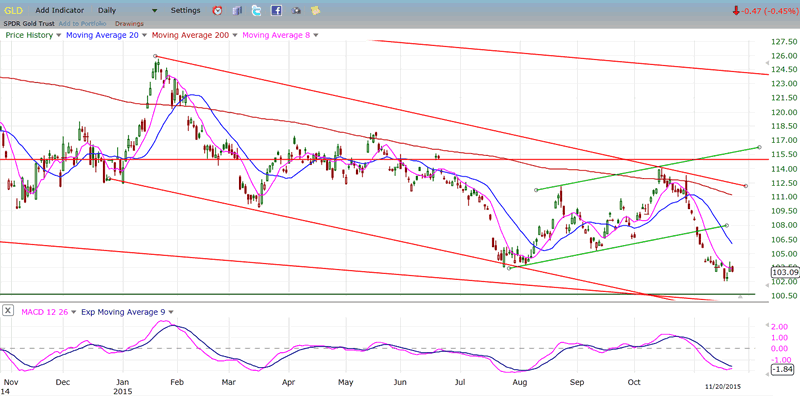
Last week, GLD made a new long-term correction low of 101.98 and then re-bounded a couple of points. Its ultimate destination should be about 100 but the structure of the phase down from 114 looks impulsive and this rebound could be the beginning of wave 4. The similarity with the down-phase which took place in July is very high and, if the similarity continues, wave 5 may develop the same profile. After wave 5 has completed, a good rally should take place.
USO (United States Oil Fund)
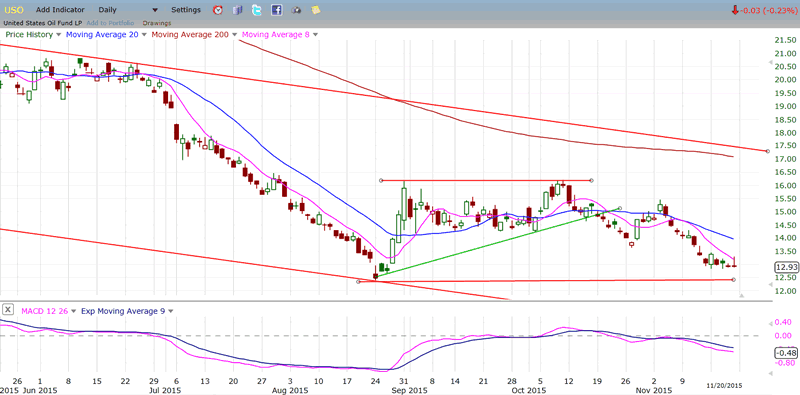
USO is holding just above its former low and is expected to break it eventually.
Summary
On Friday the 13th, SPX closed at a strong support level which was also the anticipated projection for that move. It's interesting to note that the price target of 2022, which had been determined strictly by technical analysis, withstood the effect of the devastating terrorist attack in Paris -- an event which normally should have been more influential on the market. Of course, this occurred on a Friday after the market closed. Should it have taken place on a week-day, the market reaction might have been far more negative. Nevertheless, I choose to think that this is additional proof of the value of sound technical analysis.
The rally which started from 2020 last Monday appeared to be struggling to retain its upside momentum by the end of week. Even if prices managed to move slightly higher, it looks very much as if another correction is near.
FREE TRIAL SUBSCRIPTION
If precision in market timing for all time framesis something that you find important, you should
Consider taking a trial subscription to my service. It is free, and you will have four weeks to evaluate its worth. It embodies many years of research with the eventual goal of understanding as perfectly as possible how the market functions. I believe that I have achieved this goal.
For a FREE 4-week trial, Send an email to: info@marketurningpoints.com
For further subscription options, payment plans, and for important general information, I encourage
you to visit my website at www.marketurningpoints.com. It contains summaries of my background, my
investment and trading strategies, and my unique method of intra-day communication with
subscribers. I have also started an archive of former newsletters so that you can not only evaluate past performance, but also be aware of the increasing accuracy of forecasts.
Disclaimer - The above comments about the financial markets are based purely on what I consider to be sound technical analysis principles uncompromised by fundamental considerations. They represent my own opinion and are not meant to be construed as trading or investment advice, but are offered as an analytical point of view which might be of interest to those who follow stock market cycles and technical analysis.
Andre Gratian Archive |
© 2005-2022 http://www.MarketOracle.co.uk - The Market Oracle is a FREE Daily Financial Markets Analysis & Forecasting online publication.


