


Stock Market Make or Break, Is the US Heading Towards Recession?
Stock-Markets / Stock Markets 2015 Nov 13, 2015 - 09:47 AM GMTBy: Puru_Saxena

 The global economy is slowing down rapidly and it is conceivable that the developed world may face a recession next year. Already, the Japanese economy is contracting and even Europe is barely growing. Across the pond, the US is still muddling through but the leading economic indicators and all the major Fed regional activity surveys (Figure 1) are suggesting economic weakness ahead.
Figure 1: Is the US heading towards recession?
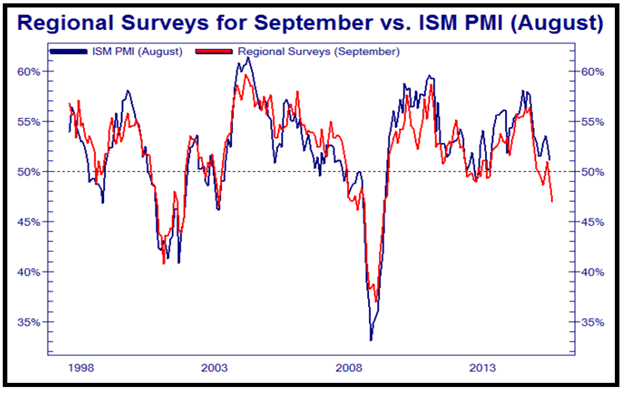
Source: St. Louis Fed, Thomson IBES
Over in the developing world, the situation is deteriorating as many nations are now facing currency devaluation and asset deflation. Furthermore, the ongoing slump in commodities is severely hurting the exporting nations (Australia, Brazil, Canada, Malaysia, Indonesia and Russia) and some of these are already in recession.
In Asia, China’s economy is really struggling and data points such as power usage, railcar loadings and trade figures indicate that the official GDP print of 7% is grossly inflated. Although nobody really knows the exact pace of China’s expansion, we are of the view that the world’s second largest economy is not growing by more than 3-4% per year. Whether you like it or not, China’s export-driven model is now acting as a major headwind for economic growth and its debt build-up (282% of GDP!) is a serious risk. Moreover, China’s asset markets are now deflating and if things get ugly, the repercussions will be felt throughout the world.
Today, the consensus view is that the US is insulated from overseas troubles and its domestic economy is doing just fine. Unfortunately, this sanguine line of thinking seems to be ignoring the fact that the S&P500 companies derive approximately 40% of their earnings from overseas! Furthermore, the optimists seem to be forgetting that the US shale industry is in serious trouble; thus America’s junk bond market may pose problems in the future.
Given the above economic weakness, the prominent central banks are desperately trying to combat the deflationary forces by cutting interest rates and buying bonds (QE). It is notable that over the past month, the PBOC cut interest rates and the bank’s minimum reserve ratio and the ECB stated that it would expand its QE initiative by year-end. Elsewhere, the Federal Reserve stayed on hold and some officials even talked about the prospects of negative interest rates!
All this central-bank intervention managed to ignite a big rally in global equities but we are fairly certain that this ‘stimulus’ will not engineer economic growth. After all, the world economy is severely over indebted, so cheap credit may not be sufficient to lure households going deeper into debt. If our assessment is correct, the odds are fairly high that business activity will slow down next year.
Turning to the stock market, there can be no doubt that last month’s rally on Wall Street was impressive but so far, the S&P500 Index has failed to surpass its all-time high. If you review Figure 2, you will note that the recent bounce has just brought the S&P500Index to its rounding top dome which has contained all rally attempts since spring. On the bullish side of the ledger, the S&P500 Index has managed to reclaim the 200-day moving average but with the market now severely overbought, at least a near-term pullback is on the cards.
Figure 2: S&P500 Index (daily chart) – rounding top?
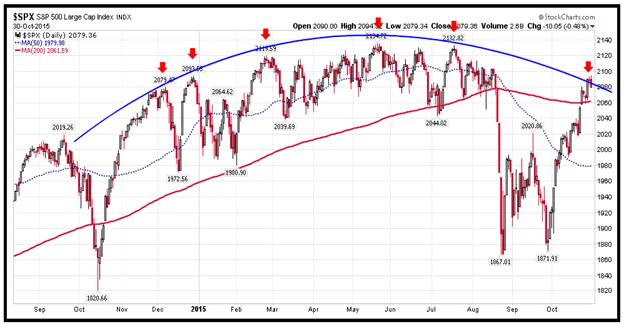
Source: www.stockcharts.com
Although anything can happen, supply/demand data and breadth indicators suggest that this is not the start of a sustained uptrend in common stocks. Instead, the stock market appears to be putting in a major top which will soon be followed by the next down leg in the bear market.
At present, the major US indices are painting a very rosy and deceptive picture. However, closer inspection reveals that the small-caps, mid-caps, growth stocks and transportation stocks have not participated in last month’s advance. Furthermore, the NYSE Operating Companies Only Advance/Decline Line is also lagging, which indicates weak market breadth.
At the start of a sustained move higher in a healthy bull market, most stocks advance on expanding volume and the leading growth stocks break out to new highs. During last month’s rally, many leading growth stocks (Apple, Celgene, Chipotle Mexican Grill, Monster Beverage, Netflix and Tesla) have struggled and only a handful of technology mega-caps (Amazon, Facebook, Google and Microsoft) have powered the major US indices towards their record highs. This time may be different but decades of history shows that such price action is typical of a major stock market top.
If you review Figure 3, you will observe that the S&P500 Equal Weighted Index is still trading beneath its overhead resistance and it has not even managed test the 200-day moving average. In our view, this price chart reveals the true weakness in the stock market and it demonstrates that on average, the largest 500 companies in the US topped out earlier this year.
Figure 3: S&P500 Equal Weighted Index (daily chart)
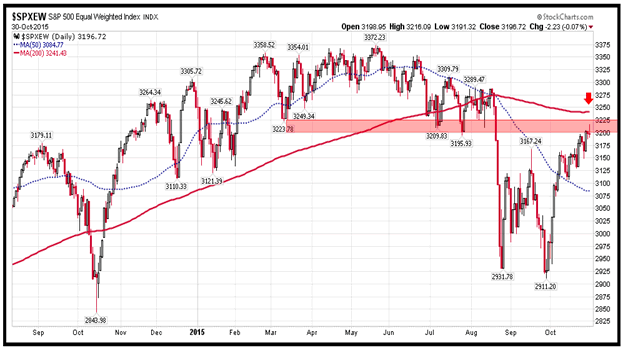
Source: www.stockcharts.com
In addition to the S&P500 Equal Weighted Index, the Russell 2000 Small-Cap Index, the Russell 2000 Growth Index and the Dow Jones Transportation Average are also showing weakness, which is not consistent with the start of a new up leg in a bull market.
Last but not least, the relief rally in the commodities complex seems to have ended and if so, additional weakness should drag down the major US indices. Over in the credit market, junk bonds have not participated in the recent festivities either and this lackluster performance is another red flag for the broad stock market. It is worth noting that there is a very tight correlation between common stocks and junk bonds and at major turning points, the latter shows the way. So, the ongoing weakness in junk bonds should not be taken lightly.
Figure 4 shows that the junk bond ETF (HYG) made a marginal new high in June and since then it has formed a series of lower highs. Furthermore, it is interesting to note that during last month’s rally attempt, it failed to surpass its September peak. Since the junk bond market tends to lead the stock market, the ongoing weakness in high yield credit needs to be monitored closely.
Figure 4: iShares iBoxx High Yield Bond Fund (daily chart)
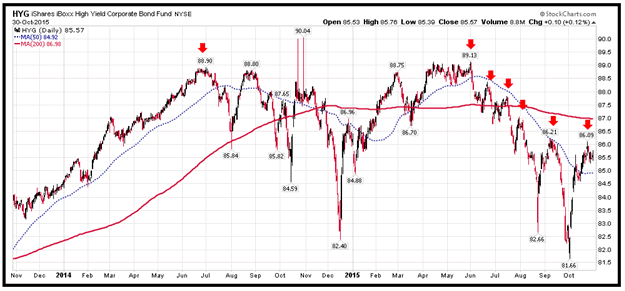
Source: www.stockcharts.com
Given the above data points, we are of the view that the stock market is in the process of completing a major top and investors should use rallies to get defensive. If our assessment is correct, the stock market rally will fade around these levels and under the most optimistic scenario; we may get marginal new highs in the major indices which will ultimately give way to the bear market.
At this stage, we do not know what may cause the stock market’s breadth to improve, but if there is additional central bank intervention, the ongoing rally may get extended. In any event, for us to change our outlook, we will need to see big gains in the small-caps, mid-caps, growth names and transportation stocks. Furthermore, we will need to see strength in the NYSE Advance/Decline Lines. Until that happens, the risk/reward will remain unfavourable and we will not re-invest in common stocks.
For our part, we have parked our managed capital in safe havens such as US Treasuries and US Dollar cash. Last but not least, we are still ‘short’ biotechnology and recently, we have put on modest ‘short’ positions on the Euro and S&P500 Index.
In summary, last month’s advance has pushed up the S&P500 Index to its rounding top dome pattern and it is now make or break time for US equities. If this is a healthy bull market, then the S&P500 Index will need to break out to new highs on improving market breadth. Conversely, if we are in the grip of the grizzly, the bellwether index will slice through the 200-day moving average and test the recent lows. At this stage of the game, either scenario can play out but given the poor breadth outlined above, the odds favour the continuation of the bear market.
Puru Saxena is the CEO of Puru Saxena Wealth Management, his Hong Kong based SFC regulated firm which offers discretionary portfolio management and research services to individual and corporate clients. The firm manages two trend-following strategies – Discretionary Equity Portfolio and Discretionary Fund portfolio. In addition, the firm also manages a Discretionary Blue-chip Portfolio which invests in high-dividend world leading companies. Performance data of these strategies is available from www.purusaxena.com
Puru Saxena also publishes Money Matters, a monthly economic report, which identifies trends and highlights investment opportunities in all major markets. In addition to the monthly report, subscribers of Money Matters also receive “Weekly Updates” covering the recent market action. Money Matters is available by subscription from www.purusaxena.com
Puru Saxena
Website – www.purusaxena.com
Puru Saxena is the founder of Puru Saxena Wealth Management, his Hong Kong based firm which manages investment portfolios for individuals and corporate clients. He is a highly showcased investment manager and a regular guest on CNN, BBC World, CNBC, Bloomberg, NDTV and various radio programs.
Copyright © 2005-2015 Puru Saxena Limited. All rights reserved.
Disclaimer: The above is a matter of opinion provided for general information purposes only and is not intended as investment advice. Information and analysis above are derived from sources and utilising methods believed to be reliable, but we cannot accept responsibility for any losses you may incur as a result of this analysis. Individuals should consult with their personal financial advisors.© 2005-2022 http://www.MarketOracle.co.uk - The Market Oracle is a FREE Daily Financial Markets Analysis & Forecasting online publication.