Fed December Interest Rate Hike Stock Market Panic Trigger For New All Time High?
Stock-Markets / Stock Markets 2015 Nov 08, 2015 - 07:27 PM GMTBy: Nadeem_Walayat
 Flip, flop, flip, the bulk of 'market analysts' that populate the mainstream media (sales) have once more flopped in favour of a December US Fed interest rate hike with some giving the odds at 100% ! (Bill Gross), which reminds me of just a few weeks ago when analysts were typically coming out with near certain statements that stocks were now definitely in a bear market i.e. giving it a 99.7% chance ! (money morning).
Nevertheless given Friday's bumper Jobs Report of 271k that far beat the academic economists average expectations of 200k, has once more prompted the consensus to quickly converge towards the likely negative consequences of what looks like a near certain Fed December US interest rate hike impact on stocks, the same consensus that bet against the stock market rally for the WHOLE of the October due to the certainty of a crash, collapse or worse materialising during the month of market panics. So it is not unexpected that the GOOD Jobs report is being perceived as more certainty for impending doom that a Fed December rate hike will herald for stocks, which are apparently sat on edge of a precipice of a collapse! ALL ignoring the fact that a 5% US Unemployment rate is actually GOOD for the economy and stocks! Though of course conspiracy theorists can play around with the figures to conclude that the real unemployment rate is 20%, if so then it must have come DOWN from 40%!
Dow Trend to Date
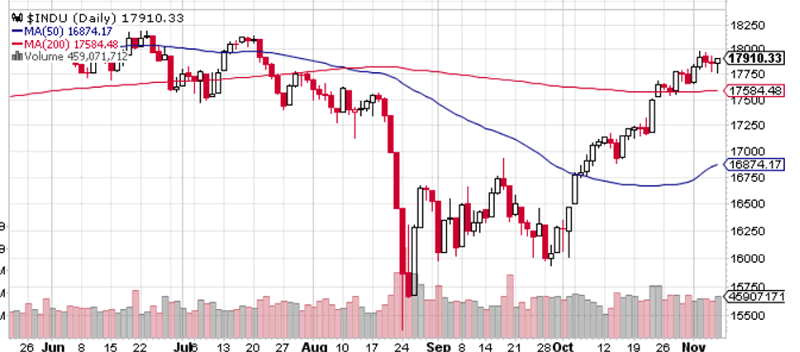
Firstly a recap of how the so called '99.7% chance' bear market has been progressing. The Dow's latest close of 17,910 near the highest for over 3 months, and positive for the year, recouping all of the plunge that took the Dow down to its August 24th low of 15,370 that prompted so much doom and gloom to emerge, now standing less than 2.5% away from its all time high of 18,351.

So basically stocks have done the EXACT opposite to what most 'analysts' expectations were for the month for Stock Market Crashes, continuing into November. The EXACT OPPOSITE! - Hold that thought because I will shortly come back to what it means going forward.
Stock Market Trend Forecast Into End Dec 2015
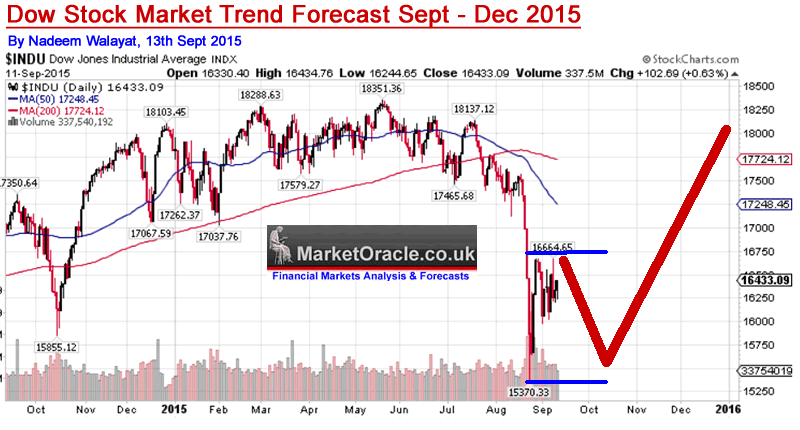
My update of Mid September on the state of the over 6 year long stocks bull market series concluded in a detailed trend forecast for the Dow to briefly rally into Mid September before continuing its correction into October before setting the scene for the Dow to rally by 20% targeting a range of 18,000 to 18,100 before the end of this year.
13 Sep 2015 - Stock Market Dow Trend Forecast for September to December 2015
My final conclusion is for continuing weakness that will result in a volatile trading range with a probable re-test of the recent low of 15,370 by Mid October that will set the scene for a strong rally into the end of the year that could see the Dow trade above 18,000 before targeting a gain for a seventh year in a row at above 17,823 as illustrated below:

The latest close of 17,910 has the Dow within touching distance of my year end target range of 18,000 to 18,100. And as my recent update pointed out that the relative strength implies that the Dow could set a NEW All time high during December.
04 Nov 2015 - Stocks Bear Market Resolving Towards New All Time High Before End of 2015
Therefore the stock market clearly is clearly showing relative strength which implies my bullish forecast objective looks set to be achieved significantly earlier than expected which means that the Dow looks set to make a new all time high before the end of this year i.e. to trade above 18,351.
STOCK MARKET QE AND INTEREST RATES
As for what interest rate hikes imply for the stock market I again refer to my in-depth analysis of Mid September :
13 Sep 2015 - Stock Market Dow Trend Forecast for September to December 2015
From QE1, to QE2 to QE3, the Fed since before this stocks bull market began has been printing money and buying mostly government bonds from their fellow bankster brethren the successful result of which has been to suppress interest rates and generate artificial profits for the banks to continue to bank as bonuses for fictitious performance levels. Where the stock market is concerned is that the flood of over $4 trillion of money printing has played a large part in driving the stocks bull market, much as I voiced right at the start of this bull market in March 2009(15 Mar 2009 - Stealth Bull Market Follows Stocks Bear Market Bottom at Dow 6,470 ).
For the whole of 2015 there has been building expectations for the Fed to raise interest rates that had focused on September being the month. However, now that September is actually here, the question to be asked is will the Fed finally pull that trigger or will they err on the side of caution and delay for another month or so ?
In my opinion, whether the Fed raise rates or not this month does not really matter too much at this stage because it will be just a token move of raising rates from 0.25% to 0.50% rather than signaling a series of monthly rate hikes.
So whilst a rate hike would galvanise the bears to herald another stock market collapse as being imminent, the probable reality will be that when the dust settles the stock market will probably be trading several percentages higher a month after the first rate hike. Which means any dip in stocks following the first rate hike is likely to be temporary and nowhere near on the scale of the recent decline.
In fact stocks and housing are more likely to rise during a rate hiking cycle and fall during a cutting cycle which is the exact opposite of the consensus view! Which is common sense because interest rates are cut in times of economic weakness, recession, financial panics, whilst interest rates are raised to cool an over heating booming economy or in response to an Inflation panic, neither of which is taking place today with US CPI inflation of just 0.2% and GDP growth expectations of just 2.5%. So in economic terms, the case for significantly raising interest rates is just not there.
Quick Stock Market Analysis into End 2015
Therefore having already concluded that a trend towards a Dow New All Time High during December is probable, what's left to determine is the probable route the Dow could take to get there.
A quick technical take suggests -
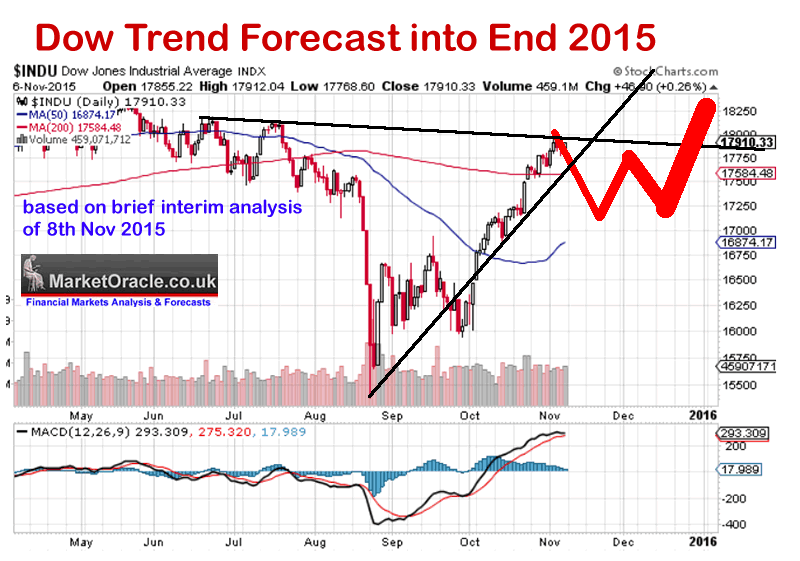
1. Stocks are clearly overbought as illustrated by the MACD and are imminently due a correction.
2. Stocks are likely to trade lower into the December 15th / 16th Fed Meeting, which does not give the Stocks much TIME to rally i.e. only a couple of weeks.
Therefore this implies the trend to a new all time high is likely to start AFTER the Mid Dec FOMC meeting. So will 2 weeks be enough time to set a new all time high? That is a very tough call that given the timing of the next Fed meeting that the Dow could JUST miss setting a new all time high before the end of December. The following graph better illustrates what is going through my mind in terms for the probable prospects for the Dow into the end of 2015.

Stocks Bull Market 2016 and Beyond
While it is too early for my in-depth analysis and detailed trend forecast for the Dow for 2016, however a brief reminder of long standing view illustrates that nothing so far has transpired that implies that 2016 will not ALSO turn out to be another bullish year for stocks for the 7th consecutive year!
"Look it's simple, very simple, stocks are NOT in a bubble, until stocks reach the bubble stage then they are unlikely to resolve into a bear market, having traded stocks for over 30 years, I KNOW what a bubble looks like! In fact the bubble top may turn out to be another 4 or 5 years away! Imagine that a bull market that continues for another 4 or 5 years! IMAGINE IT, now imagine the perma bear nonsense that is going to flow as stocks relentlessly climb ever higher, do you really want to miss another 4-5 year bull run?"
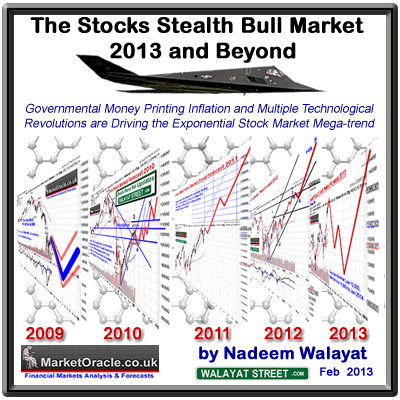
 Let alone the probability that stocks could continue marching higher for several more years as I alluded to in my Feb 2013 Stocks Stealth Bull Market 2013 and Beyond ebook (FREE DOWNLOAD).
"If you have actually read the whole of this analysis (rather than just skipping to the conclusion) then the message you will get is one of an ongoing stocks bull market that like a coiled spring is prepping itself to propel the stock market to levels that cannot be imagined today I.e. my Elliott Wave and broadening top analysis gives strong indications for longer-term expectations. For instance, I can easily see the Dow trade at 20,000 during 2017, so expect plenty more Stocks Stealth Bull Market ebook's to follow."
And now over 2.5 years on from the then Dow 13,992 level, Dow 20,000 during 2017 appears very probably, so what then for the perma-bear crowd for the whole of 2016 and into 2017?
And finally remember "greater the deviation from the bull market peak then the greater the buying opportunity presented".
Ensure you are subscribed to my always free newsletter for ongoing in-depth analysis and concluding detailed trend forecasts that include the following planned newsletters -
- US Dollar Trend Forecast Update 2015
- US House Prices Forecast
- Stock Market 2016
- Islam 3.0
 Also subscribe to our Youtube channel for notification of video releases and for our new series on the 'The Illusion of Democracy and Freedom', that seeks to answer questions such as 'Did God Create the Universe?' and how to 'Attain Freedom' as well as a stream of mega long term 'Future Trend Forecasts'.
By Nadeem Walayat
Copyright © 2005-2015 Marketoracle.co.uk (Market Oracle Ltd). All rights reserved.
Nadeem Walayat has over 25 years experience of trading derivatives, portfolio management and analysing the financial markets, including one of few who both anticipated and Beat the 1987 Crash. Nadeem's forward looking analysis focuses on UK inflation, economy, interest rates and housing market. He is the author of five ebook's in the The Inflation Mega-Trend and Stocks Stealth Bull Market series that can be downloaded for Free.
 Nadeem is the Editor of The Market Oracle, a FREE Daily Financial Markets Analysis & Forecasting online publication that presents in-depth analysis from over 1000 experienced analysts on a range of views of the probable direction of the financial markets, thus enabling our readers to arrive at an informed opinion on future market direction. http://www.marketoracle.co.uk
Disclaimer: The above is a matter of opinion provided for general information purposes only and is not intended as investment advice. Information and analysis above are derived from sources and utilising methods believed to be reliable, but we cannot accept responsibility for any trading losses you may incur as a result of this analysis. Individuals should consult with their personal financial advisors before engaging in any trading activities.
Nadeem Walayat Archive |
© 2005-2022 http://www.MarketOracle.co.uk - The Market Oracle is a FREE Daily Financial Markets Analysis & Forecasting online publication.


