


Stock Market Continued Correction Possible
Stock-Markets / Stock Markets 2015 Nov 08, 2015 - 03:38 PM GMTBy: Andre_Gratian

 Current Position of the Market
SPX: Long-term trend - Bull Market
Intermediate trend – SPX has resumed its uptrend in order to complete the last phase of the bull market.
Analysis of the short-term trend is done on a daily basis with the help of hourly charts. It is an important adjunct to the analysis of daily and weekly charts which discusses longer market trends.
Daily market analysis of the short term trend is reserved for subscribers. If you would like to sign up for a FREE 4-week trial period of daily comments, please let me know at ajg@cybertrails.com
CONTINUED CORRECTION POSSIBLE
Market Overview
After reaching a new rally high of 2116.48 on Tuesday, SPX declined 33 points before finding support at the 2084 level. A Friday close of 2099 may indicate that the correction is over. It is also possible that the bounce is only a mid-phase correction which will be followed by lower prices by the end of the week. That will depend on how much extension there is to the current bounce. A move beyond 2110 would suggest that another short-term high is likely before a more extended correction.
All of the action since the 1867 low (8/25) is more than likely the last phase (primary wave V) of the bull market which started in March 2009. Its completion should therefore be the completion of the bull market. It is not clear how much more time will be required before the end of the six-year uptrend, but I am sure that the market itself will give us ample warning.
Intermediate Indicators Survey
Last week, the weekly MACD continued to increase its recovery and reached -5.50 with the histogram making a new high of 11.91.
The weekly SRSI remained at 100 (the top of its range) for the third straight week.
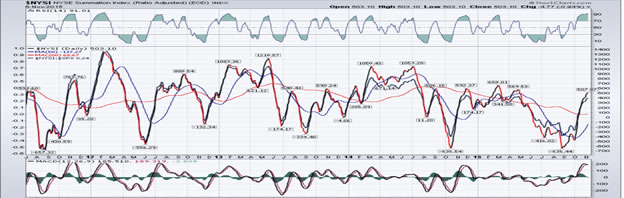
The NYSI (courtesy of StockCharts.com) has now risen to 508 and is approaching its April high of 570, but the extremely overbought RSI suggests that it is about to roll over. The MACD has already begun to retrace.
After reaching its top channel line, the 3X P&F chart of the SPX has now started to pull away as it consolidates. Although much more work is required to complete the topping pattern, this could be the very beginning of that process.
Chart Analysis
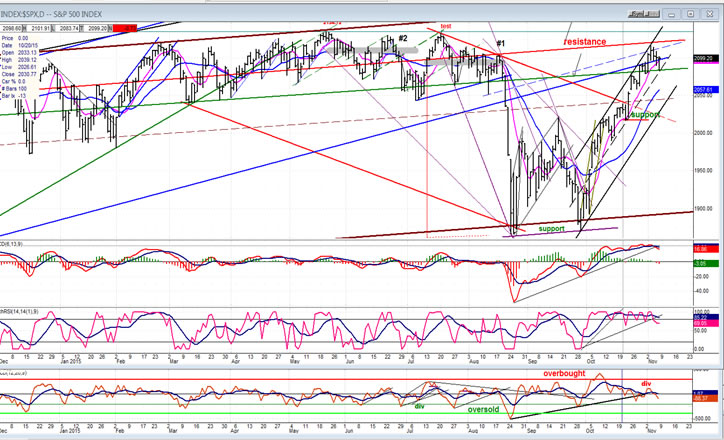
Daily SPX chart (courtesy of QCharts.com, as well as others below).
The path of the SPX is easy to follow on the daily chart. After re-testing its August lows, the index started an uptrend which is confined to a channel. The momentum strength has kept it in the top half of that channel ever since it entered it. On Tuesday, it reached the top channel line once again and pulled back for the rest of the week, again finding support on the mid-channel line and bouncing into the close. The price activity of the past week has also taken place between a resistance and a support line, while at the same time back-testing the lower trend line of its intermediate channel. If it fails to make a new high in the next couple of days, it will be vulnerable to a larger and deeper correction which would take the price through the mid-channel line and perhaps continue until it has reached the bottom line of the black channel. At some point in this uptrend, it will happen and now is just as good a time as any. When it does, it will be a warning that the next high will most likely be the end of the rally from 1872 and, if the next retracement breaks through the lower channel line, it will probably imply that the bull market has come to an end. But this will have to be confirmed by a decline below 1867.
The momentum indicators are describing the same scenario. They have flattened after reaching their peaks, and last week they started to roll over more decisively. As usual, the A/D oscillator was the first to warn of the coming weakness. After reaching its overbought peak, it started to decline steadily and last week rallied enough to show ample negative divergence at the new price high before turning down once again. There are now signs that we are beginning to lose our upside momentum and therefore become increasingly vulnerable to the first significant correction of the uptrend.
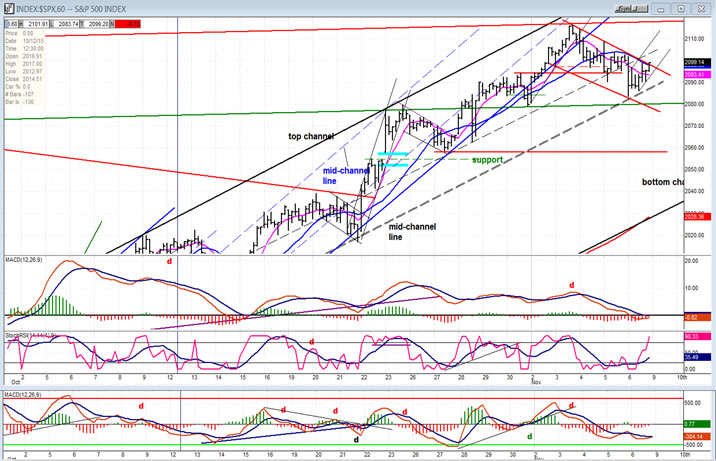
- Hourly SPX chart.
- The hourly chart shows more clearly how the index has kept its price pattern inside the top half of the channel and how, after retracing over thirty points, it found support on the mid-channel line again on Friday. By the end of the day it had bounced enough to challenge the top of the small correction channel and even closed slightly outside. This alone suggests that it should trade higher on Monday. If it fails to make a new high, it will simply add to the distribution which is already in place and create a larger pattern on the P&F chart, and this would increase the potential size of the next correction.
- That the bounce has more to go is also visible in the SRSI which has broken out of its base and created an uptrend which has already reached the 100 level. But the fact that the MACD and A/D oscillator still have not started up almost ensures that they will both show some negative divergence as the index moves higher, thereby limiting its potential upside progress.
-
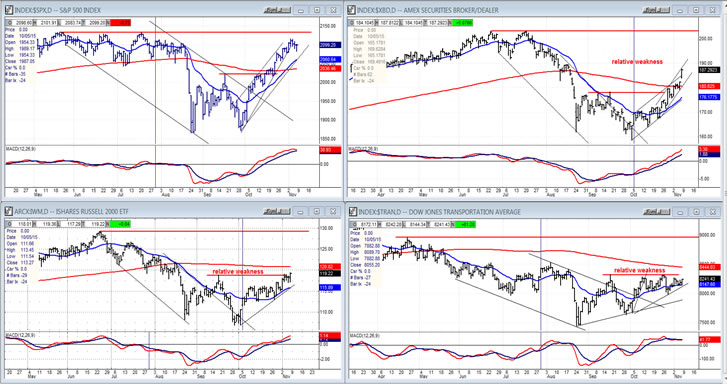
- XBD (American Securities Broker/Dealer) and more
- The sustained strength of the SPX finally had some effect on XBD which spiked after overcoming its 200-DMA. However, it still retains much relative weakness to SPX which is getting close to making a new high, while XBD is not.
- Of the other two, IWM is beginning to crawl out of its base and could start to play catch up also; but TRAN remains the weakest and, if the market has not finished its correction, it could even make a new short-term low as the market retraces.
-
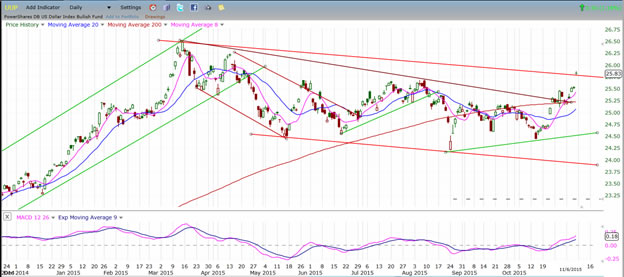
UUP (dollar ETF)
UUP had already started a move to continue its intermediate uptrend by breaking out of its downtrend line. Last Friday, it received a boost from the strong jobs report, and this almost propelled it out of its consolidation channel. Since the strong report also raised the prospect for a Fed interest hike in December, this should help the dollar prolong its new uptrend.
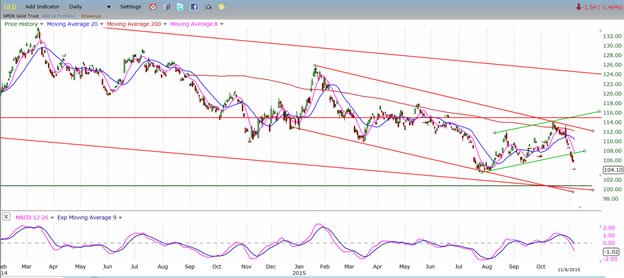
GLD (Gold trust)
I have been skeptical that GLD could end its correction and start a new uptrend before it dropped down to its long-standing projection target of 100. The newly found strength in the dollar is providing GLD with that opportunity, especially since a confirming pattern was recently formed by the price action..
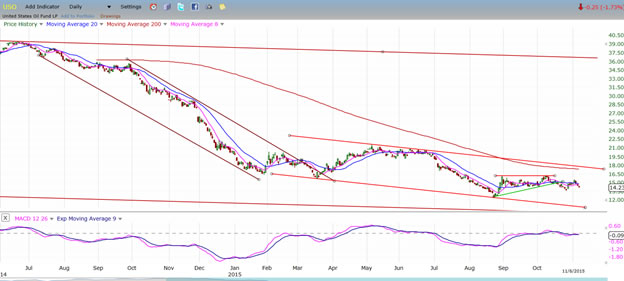
USO (United States Oil Fund)
The portion of the decline that you see here in USO represents about one third of its decline from its high of 119 which was reached in July ’08. About six months later, the index was trading at 23 and never really recovered. It languished in a long flat pattern for a little over 5 years before dropping down to 13 recently. And this, during one of the longest bull markets in history.
There is probably more to this severe price attrition than an oil glut. We may be witnessing the last throes of the fossil industry. New technology for producing energy is rapidly expanding and it may soon relegate oil to the way of the dinosaurs. As an example, the largest fusion reactor in the world, which is housed at the Max Planck Institute in Germany, is set to turn on later this month!
Summary
A week ago, it looked as if SPX was ready for a minor correction. This took place this past week with the index dropping 33 points.
It is not clear if the correction is over or if, with Friday’s bounce, the index is preparing for another phase of the decline to lower levels. We should know in a couple of days.Andre
FREE TRIAL SUBSCRIPTION
If precision in market timing for all time framesis something that you find important, you should
Consider taking a trial subscription to my service. It is free, and you will have four weeks to evaluate its worth. It embodies many years of research with the eventual goal of understanding as perfectly as possible how the market functions. I believe that I have achieved this goal.
For a FREE 4-week trial, Send an email to: info@marketurningpoints.com
For further subscription options, payment plans, and for important general information, I encourage
you to visit my website at www.marketurningpoints.com. It contains summaries of my background, my
investment and trading strategies, and my unique method of intra-day communication with
subscribers. I have also started an archive of former newsletters so that you can not only evaluate past performance, but also be aware of the increasing accuracy of forecasts.
Disclaimer - The above comments about the financial markets are based purely on what I consider to be sound technical analysis principles uncompromised by fundamental considerations. They represent my own opinion and are not meant to be construed as trading or investment advice, but are offered as an analytical point of view which might be of interest to those who follow stock market cycles and technical analysis.
Andre Gratian Archive |
© 2005-2022 http://www.MarketOracle.co.uk - The Market Oracle is a FREE Daily Financial Markets Analysis & Forecasting online publication.