


Retirees: I Did Not Buy IBM to Sell, It’s About The Dividend Income Stupid
Companies / Dividends Oct 23, 2015 - 09:39 PM GMT

 There are many investing strategies and principles that retired investors can utilize to reduce the risk associated with investing in equities (stocks) for their retirement portfolios. Choosing to invest in the highest quality stocks your mind can conceive sits at the top of the list. There are many components that investors can analyze and examine to determine whether a company is high quality or not.
The primary determinant of high quality is superior financial strength. Financially strong companies possess the staying power and resources to weather the occasional bad storms that will inevitably occur. Every business will on occasion face challenges and difficulties. Meeting those challenges requires a strong balance sheet and an adaptive and competent management team to guide the company across troubled waters.
Evaluating financial strength can be accomplished through the examination of a few simple but important fundamental metrics. Fortunately, much of that work is already done for us by established and reputable reporting agencies such as Standard & Poor’s, Value Line, MorningStar, etc., in the form of credit ratings.
There are many available sources where retired investors can find that information. The key is to look for companies that are awarded what is referred to in financial circles as investment-grade ratings. Typically, the companies with the best ratings will have a capital A or better in their credit rating.
Retired investors concerned with safety can dig deeper by examining important fundamentals such as cash flow, free cash flow and debt levels. Stated overly-simplistically, you will be looking for companies that have the strength of cash flows to support debt payments and current and future dividend distributions. Regarding safety considerations, cash flows are more relevant than earnings. Because when it comes to the survival of a business, cash flow is king. As it relates to safety, a business surviving as an ongoing concern is the last line of defense.
Additionally, when it comes to determining the safety associated with investing in a stock, determining whether it possesses superior financial strength is an obvious and commonly-utilized approach. However, there are additional important safety measurements that are more subtle, less understood and often either ignored or their importance not given the credit deserved.
These more subtle safety measurements are an above average, but sustainable, current dividend yield and sound valuation, or better yet, significant undervaluation. The remainder of this article will examine the financial strength and these two important but more subtle safety measurements as they apply to the much-maligned blue-chip stalwart IBM.
IBM’s Financial Strength
IBM was founded in 1910, and Incorporated in the state of New York in 1911. The company took on the iconic IBM name in 1924. Consequently, IBM has been an American technology stalwart even before technology became cool. As such, IBM has been long-renowned as a blue-chip dividend growth stock. So much so that legendary investor Peter Lynch once quipped “no one ever gets fired for buying IBM.”
Here are IBM’s Credit Ratings from 3 Reputable Sources:
Standard & Poor’s: AA-
MorningStar: AA-
Value Line: AA+
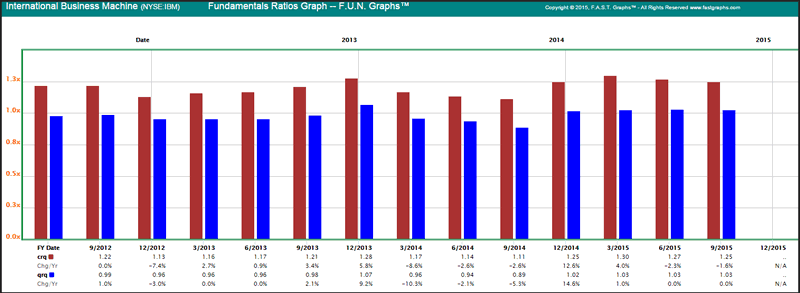
IBM Liquidity Ratios
IBM’s current ratio (crq) is and has been above 1, indicating that the company is fully capable of paying its obligations. IBM’s quick ratio (qrq) also supports its ability to meet short-term obligations. Importantly, both of these ratios continue to remain within IBM’s historical norms.
IBM’s Dividend Yield, Record and Sustainability
In the title of this article I sarcastically included the phrase “it’s about the income stupid.” However, I was not merely attempting to be sardonic, because that phrase represents a significantly important principle about investing in large blue-chip dividend growth stocks. Regardless of whether you’re investing in revered blue chips such as Johnson & Johnson (JNJ), Procter & Gamble (PG), Coca-Cola (KO), or IBM (IBM), etc., it would be naïve on your part to believe you will automatically or always outperform the market on a total return basis.
Behemoths such as those described above have simply become too large to grow fast. Their primary appeal derives from their safety characteristics and the dividend income they have produced in the past, and are capable of providing in the future. In this regard, it would not be naïve to believe that these blue-chip dividend stalwarts might produce significantly more future dividend income than the general market, because in truth and historical fact, they all have - IBM included.
Stated more directly, investing in blue-chip dividend growth stocks is not about how much their stock price might appreciate. Instead, it’s about their safety and how much dividend income and dividend income growth they can provide retired investors long into the future. However, this is not to suggest that they do not possess the capacity for capital appreciation, because they all do. This is especially true if they are purchased at sound or attractive valuations. I will discuss the importance of sound and attractive valuation in more detail later.
This brings me to a specific discussion about IBM and its dividend history. This blue-chip stalwart has paid its stockholders a dividend every year, in fact, every quarter, since 1916. Moreover, it has increased its dividend for the past 20 consecutive years at a rate of approximately 15% per annum. As an important aside, this dividend growth rate is significantly greater than its historical earnings growth rate.
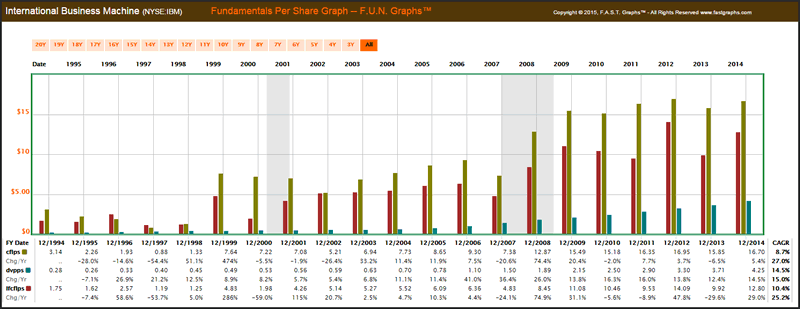
IBM’s Dividend Growth 1995-2014
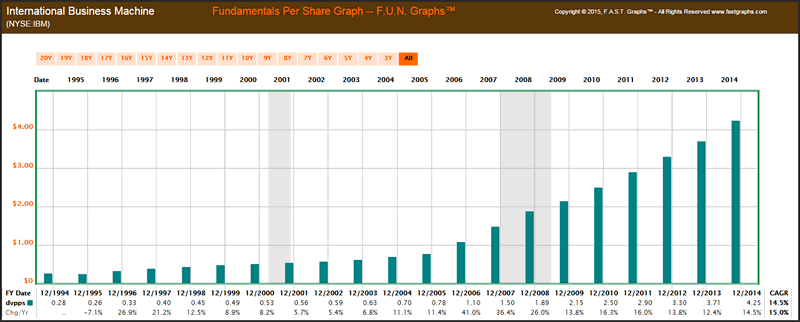
Part of this can be attributed to the fact that its payout ratio has steadily increased from a low of 12% in 1996, to its 2014 payout ratio of 26%. But most importantly, IBM’s low payout ratio coupled with its strong free cash flow generation suggests that above-average dividend growth is likely to continue long into the future. When investing in IBM for your retirement portfolios, it’s all about the income.
When you examine the following performance results on IBM since December 29, 1995, I direct your attention to two important columns. The first column to review is “Dividends per Share” where you can see the consistent and significant growth of their dividend rate per share for each year. The second column I suggest you focus on is “Dividends Declared.” With this column you will see the annual growth of dividend income based on an original $10,000 investment. I contend that this is the primary reason for considering IBM in your retirement portfolios.
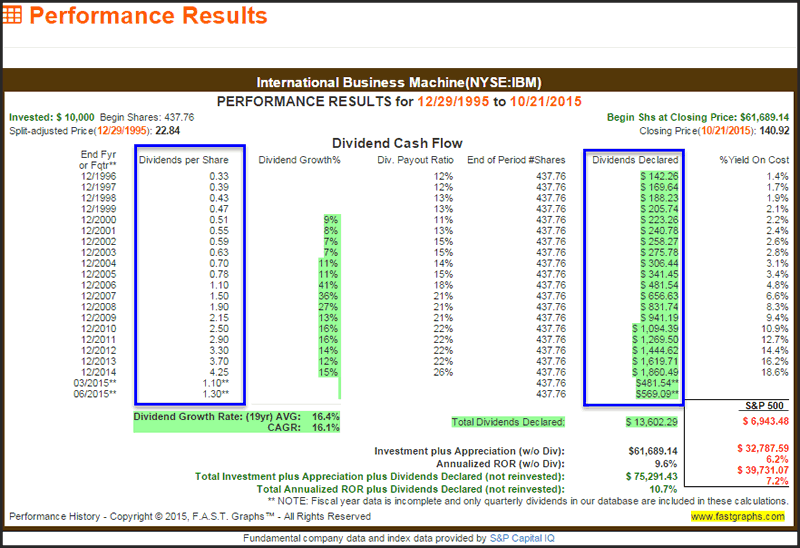
Next is the consideration of IBM’s high current yield of approximately 3.7%. This is significantly above the current yield of 2.2% for the S&P 500. In addition to the obvious income benefit, an above-average current yield also serves as an important safety attribute. In theory and principle, every dividend payment you receive from a dividend growth stock technically reduces the amount of capital you have at risk. Higher-yielding stocks like IBM are in essence reducing your risk every time they send you a dividend check. This minimization of risk is especially relevant when the above-average yield payments are growing as quickly as they are with IBM.
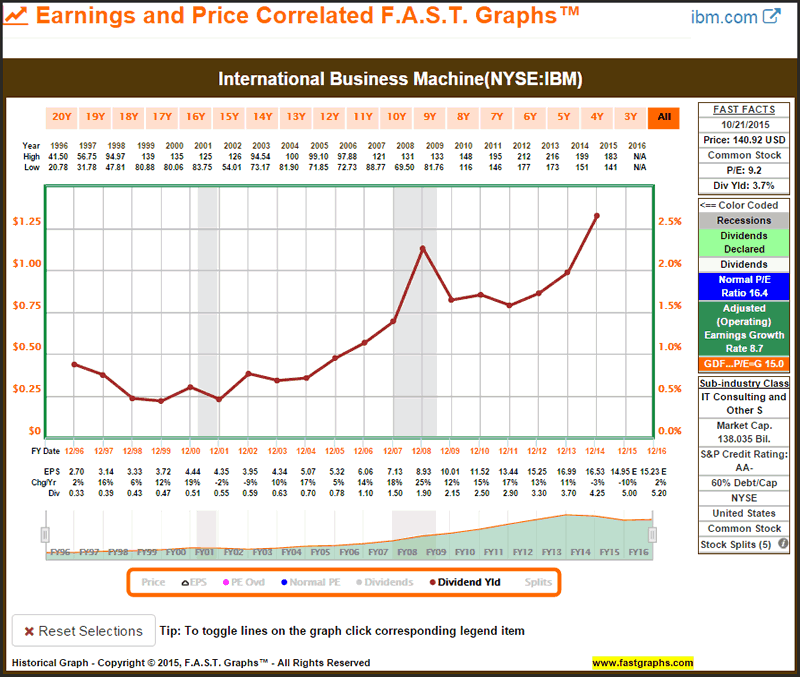
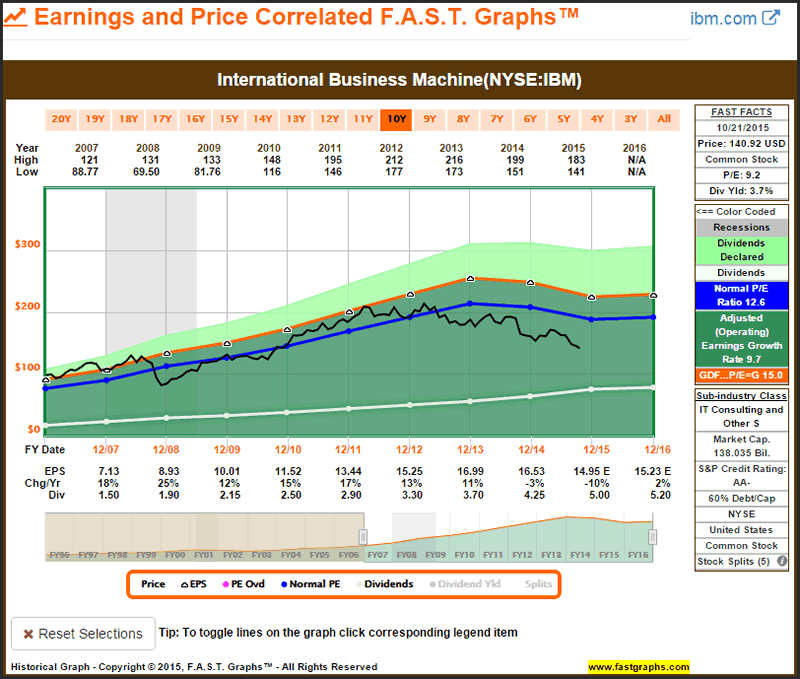
The following F.A.S.T. Graphs™ plots IBM’s historical current yields since 1996. Notice that this is the highest current yield that IBM has offered shareholders over that timeframe. In addition to the benefits cited above, this is also an important valuation measurement. IBM’s current valuation will be elaborated on more fully in the next section.
In his book “The Single Best Investment-Creating Wealth with Dividend Growth” money manager Lowell Miller presented his simple formula for identifying his idea of a potential single best investment candidate as follows:
“High-Quality
+ High Current Dividend
+ High Growth of Dividend
= High Total Returns”
From what I have presented thus far, IBM qualifies superbly. However, since I’m also known as MisterValuation it’s important to me to add fair or attractive valuation as an additional metric to Mr. Miller’s formula. Although I agree that the above three qualities that Mr. Miller offers are important, and very likely to lead to high total returns, I contend that those returns will be greater and the risk lower when fair or attractive valuation is added to the equation. Therefore, with all due respect to Mr. Miller, I would personally revise his formula as follows:
High-Quality
+ High Current Dividend
+ High Growth of Dividend
+ Attractive Valuation
= High Total Returns
Now that I’ve reviewed IBM’s dividend yield and historical record, it’s time to move on to the important discussion of IBM’s dividend sustainability. As I previously suggested, cash flow is “king” when evaluating the sustainability of a company’s ability to pay its dividend. The following FUN Graph (fundamental underlying numbers) plots IBM’s cash flow per share (cflps), levered free cash flow per share (lfcflps) and dividends paid per share (dvpps) from 1995 to 2014.
A quick examination of this graph illustrates that IBM’s dividend has been more than adequately covered by its prodigious cash flow generation (Note: levered free cash flow is after interest on debt has been paid). And perhaps more importantly, the graph illustrates that there is plenty of room for IBM to pay even larger dividends if management considered it appropriate.
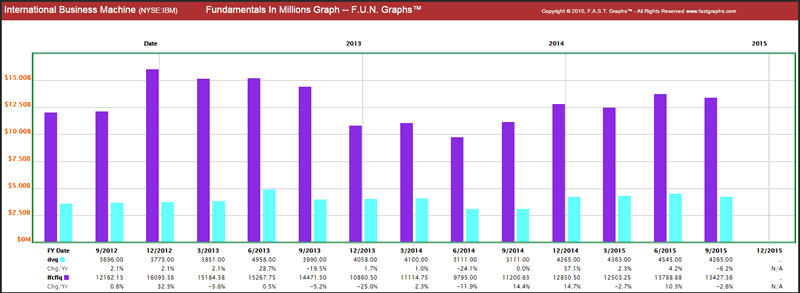
This next graph presents levered free cash flow (lfcflq) and dividends (dvq) in millions of dollars for the last several quarters to include their most recently completed quarterly report for the period ending September 2015. Although IBM has been greatly maligned by many pundits, it is clear to me that levered free cash flow continues to support their dividends.
IBM’s current Valuation
Based on my many years of experience investing in common stocks, I have concluded that assessing fair valuation is a primary consideration investors should always attempt to make. Stock markets are auctions and therefore stock price movements are driven by supply and demand in the shorter run. Consequently, stock prices can be driven either dramatically above or below fair value at any moment in time. However, in the longer run, stock prices are driven by the fundamental strength and performance of the business behind the stock.
Therefore, the daily gyrations of stock prices can lead investors into making short-term mistakes that are typically driven by the emotions fear or greed. However, investors should remain acutely aware that the short-term will inevitably evolve into the long-term. Consequently, if you overpay for a stock in the short run, you are highly likely to either lose money or experience poor long-term performance that does not compensate you for the risk you take.
In contrast, if you buy a stock below its intrinsic value, you are likely to earn returns that are even greater than the operating performance of the company in the longer run. But best of all, buying at low valuation reduces your long-term risk at the same time. However, in order to achieve those greater returns at lower levels of risk, it requires patience and an understanding of the company’s financial strength.
Once a common stock has momentum either up or down, that momentum can continue for a period of time. Unfortunately, they don’t ring a bell at the top or bottom of a market. Therefore, an overvalued stock can continue to rise short-term, just as an undervalued stock can continue to fall in the shorter run. Unfortunately, there is no way to predict in advance the precise moment or level when that might change. Therefore, you have to be patient and trust fundamentals more than price action in order to reap the benefits of investing at low valuations.
The following earnings and price correlated F.A.S.T. Graphs™ on IBM clearly illustrates that stock price has fallen significantly farther than recent weak earnings justify. While many are traumatized by the dropping stock price over the past few years, I see nothing but opportunity. Having the chance to invest in a high-quality blue-chip like IBM at a P/E ratio less than 10 and a growing current dividend yield of 3.7% does not present itself very often. As an investor looking for safety and yield, I find IBM currently irresistible. Since I’m not investing to sell IBM, my focus is on the well-covered and growing dividend yield.
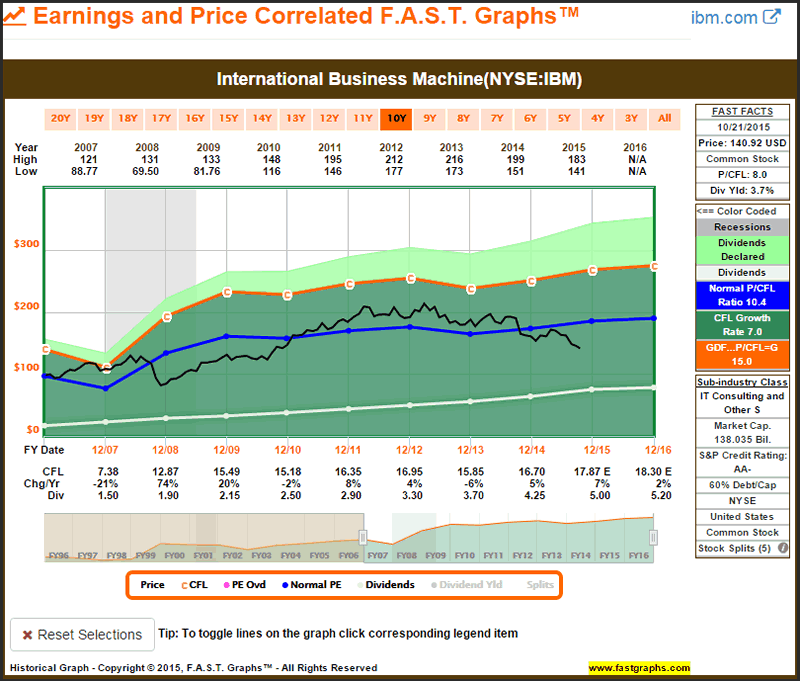
Furthermore, when I evaluate IBM based on cash flows, the picture is much more sanguine. As seen above, earnings have been under pressure, but cash flow generation has remained solid. Although earnings are the primary driver of stock price, cash flow is the primary source of a company’s ability to generate continuing dividends. I see no risk to IBM’s dividend at this time.
A Growing Dividend Income Stream Was My Purpose for Investing In IBM
I have been, and continue to be aggressively adding IBM into retirement portfolios. However, even upon my first foray into the company, I was never expecting substantial capital appreciation, at least over the short to intermediate term. Instead, my attitude about investing in this company was based solely on the opportunity to receive a safe, above-average and growing dividend yield. On that basis, IBM has proven to be a resounding success because, as I expected, IBM’s dividend income has steadily increased.
In the same context, I did not invest in IBM with the idea of selling it. Instead, my objective was to become a permanent, long-term shareholder/owner of this dividend growth stalwart. When I invest in dividend growth stocks for retirement, I always do it with a long-term view. My minimum definition of the long-term is a complete business cycle; this is typically 3 to 5 years.
However, although 3 to 5 years is my minimum definition of long-term, it is not my ideal investment objective. My ideal investment objective is to own a company permanently. I don’t invest in the stock market, I invest in what I believe are great businesses, purchased at sound and attractive valuations, that I expect to own forever.
Consequently, once I have laid my money down, I pay little or no attention to its stock price action. Since I have no intention of selling, what the market is pricing my company at is of absolutely no significance to me. On the other hand, since I am primarily focused on income today, the current level, consistency and growth of the dividend payment is of paramount importance. As long as the dividends keep coming in, I am happy and consider the investment a success. And even better, as long as they continue to grow, I am meeting and exceeding my objectives, and therefore, quite happy with my decision.
Once again, in that regard, IBM has been a resounding success. Moreover, I consider the fact that its price has continued to drift lower a major plus. After the long bull-run in the general stock market we have recently enjoyed, it has become quite rare to find high-quality dividend growth stocks at attractive value. In the face of today’s low interest rates, yield hungry investors have driven the values of most quality dividend growth stocks too high.
I have penned three articles on IBM since May 2012 found here, here and here. Since the publication of my first article, IBM’s stock price has drifted down approximately 27%. However, IBM has remained profitable over this timeframe, but admittedly earnings per share have not grown. In contrast, cash flow per share has continued to grow, albeit at a moderately low rate. Nevertheless, this continues to give me confidence that IBM’s dividend is secure and capable of continuing to grow.
Summary and Conclusions
My case supporting investing in IBM is totally predicated on its generous current yield and my view of the safety and sustainability of its business. There is no shortage of positive and negative articles or reports across numerous financial blogs on IBM. Some of them contain important facts, but in my judgment, most of them represent simply the opinions of others. Personally, I prefer facts over opinions.
I recently watched an interview with Ginni Rometty, chairman, president and chief executive officer of IBM and she shared some rather startling facts about the company. Responding to the question is IBM cool? - she offered the following, which I paraphrase:
If it’s cool that 90% of the banks in the world run on IBM, then IBM is cool. If it’s cool that 80% of the airlines in the world run on IBM, then IBM is cool. If it’s cool that 60% of all the transactions in business in the world are done by IBM, then IBM is cool.
IBM is an entrenched technology stalwart and bellwether that possesses a wide moat based on its large and established customer base. The company is currently engaged in a transformation to stay current in the rapidly changing technology environment. This is not the first time that IBM has been required to do this in their storied past. Odds are, it won’t be the last. Consequently, I would refrain from attempting to place a precise number on IBM’s ability to grow going forward. However, I do believe that growth remains in their future. Consequently, I like IBM for its safety, high and growing dividend yield and its low valuation relative to its fundamental strength.
Disclosure: Long IBM.
By Chuck Carnevale
Charles (Chuck) C. Carnevale is the creator of F.A.S.T. Graphs™. Chuck is also co-founder of an investment management firm. He has been working in the securities industry since 1970: he has been a partner with a private NYSE member firm, the President of a NASD firm, Vice President and Regional Marketing Director for a major AMEX listed company, and an Associate Vice President and Investment Consulting Services Coordinator for a major NYSE member firm. Prior to forming his own investment firm, he was a partner in a 30-year-old established registered investment advisory in Tampa, Florida. Chuck holds a Bachelor of Science in Economics and Finance from the University of Tampa. Chuck is a sought-after public speaker who is very passionate about spreading the critical message of prudence in money management. Chuck is a Veteran of the Vietnam War and was awarded both the Bronze Star and the Vietnam Honor Medal.
© 2015 Copyright Charles (Chuck) C. Carnevale - All Rights Reserved Disclaimer: The above is a matter of opinion provided for general information purposes only and is not intended as investment advice. Information and analysis above are derived from sources and utilising methods believed to be reliable, but we cannot accept responsibility for any losses you may incur as a result of this analysis. Individuals should consult with their personal financial advisors.
Chuck Carnevale Archive |
© 2005-2022 http://www.MarketOracle.co.uk - The Market Oracle is a FREE Daily Financial Markets Analysis & Forecasting online publication.