


U.S. Dollar, Currency Markets Trend Forecasts Update
Currencies / Forex Trading Oct 15, 2015 - 03:20 PM GMTBy: David_Petch

 I thought I would do a deeper dive to revisit the currencies and US Dollar again, because there are a lot of comments out in cyberspace and the general media about how things are not that bad. The US stock market is having a massive short-covering rally, which is merely a mechanical knee-jerk reaction to an oversold condition. As I mentioned last week, there is still going to be another 2-3 weeks of upside in the "other currencies" and commodities, but when a top is put in place, one will want to make sure they are sitting on a chair, because it will get ugly.
Currencies
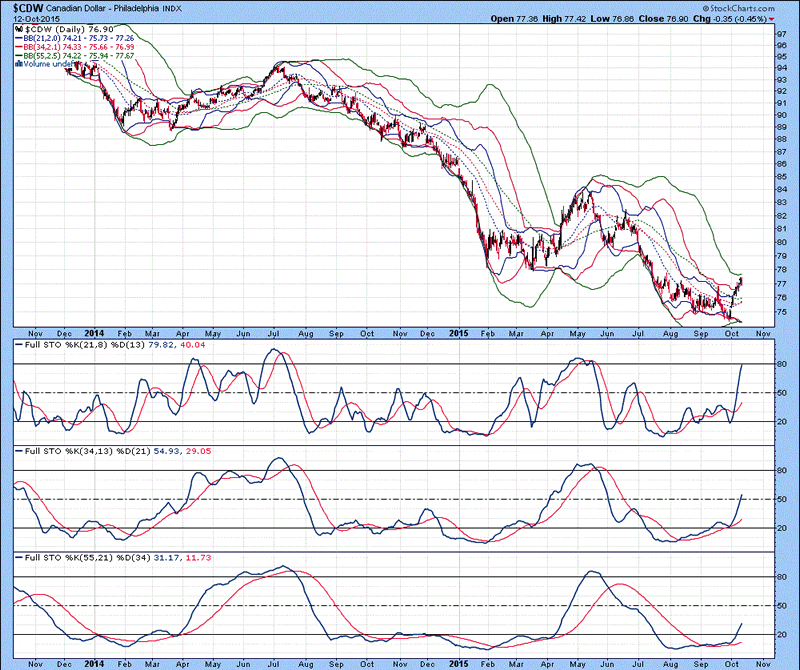
The daily chart of the Canadian Dollar Index is shown below, with the lower 21 MA Bollinger Band beneath the 34 and 55 MA Bollinger Bands in close proximity to each other indicates an oversold condition has been generated (A mild overbought condition has been generated, but two Bollinger Bands under the 21 MA Bollinger Band trumps the other). Full stochastics 1, 2 and 3 are shown below in order of descent, with the %K above the %D in all three instances. Extrapolation of the %K in stochastics 2 and 3 suggest another 3-5 weeks of sideways to upward price action before a top is put in place. The likely area for topping out remains between 79 and 80...anything higher would be extremely short lived and make the next leg down that much harder.
Figure 1
Canadian Dollar Daily Chart
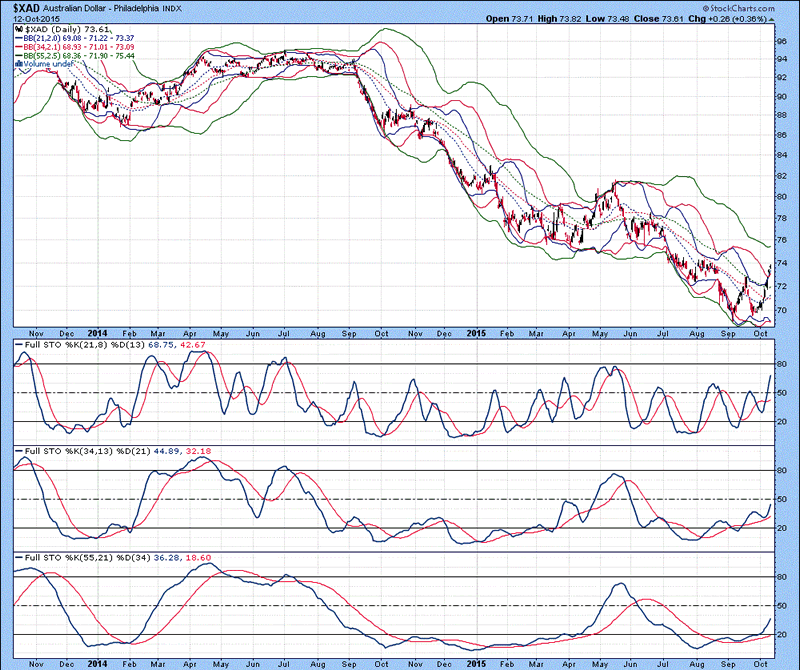
The daily chart of the Australian Dollar Index is shown below, with the upper 21 MA Bollinger Band above the 34 MA Bollinger Band indicates an overbought condition has been generated. Also, a price excursion above the upper 21 and 34 MA Bollinger Bands suggests a pause in price is likely over the next 2-4 days before any upside move occurs. Full stochastics 1, 2 and 3 are shown below in order of descent, with the %K above the %D in all three instances. The Aussie Dollar has risen 5 cents over the past month, so at the upside is limited to 76-78. There is a little more of a broader range for a top compared to the Canadian Dollar. There is the potential for another 2-3 weeks of upside before any sort of a top is put in place.
Figure 2
Australian Dollar Daily Chart
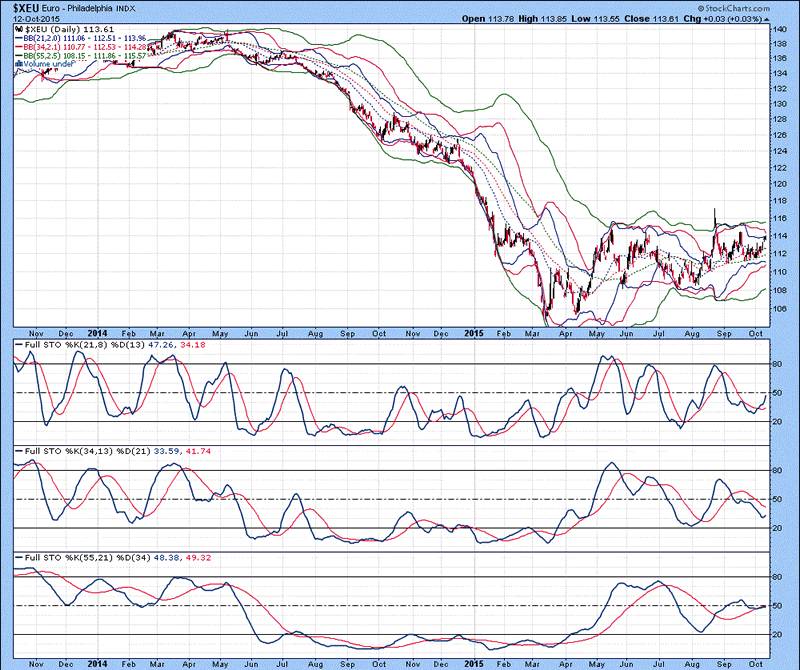
The daily chart of the Euro Index is shown below, with Bollinger Bands in their proper order of alignment indicates no overbought or oversold conditions exist at this point in time. There is currently a quadruple top in place, at 114, so a breakout above 114.5 on a weekly basis could see a move to 120. Full stochastics 1, 2 and 3 are shown below in order of descent, with the %K above the %D in 1 and 3 and beneath the %D in 2. Extrapolation of the %K trend in stochastic 1 suggests 2-3 weeks of continued sideways to upward price action before any sort of a top is put in place. As with many commodities, there was a strong surge last week, so expectations of another 2-4 days at a minimum of sideways price action before another move higher should be considered.
Figure 3
Euro Daily Chart
US Dollar Index
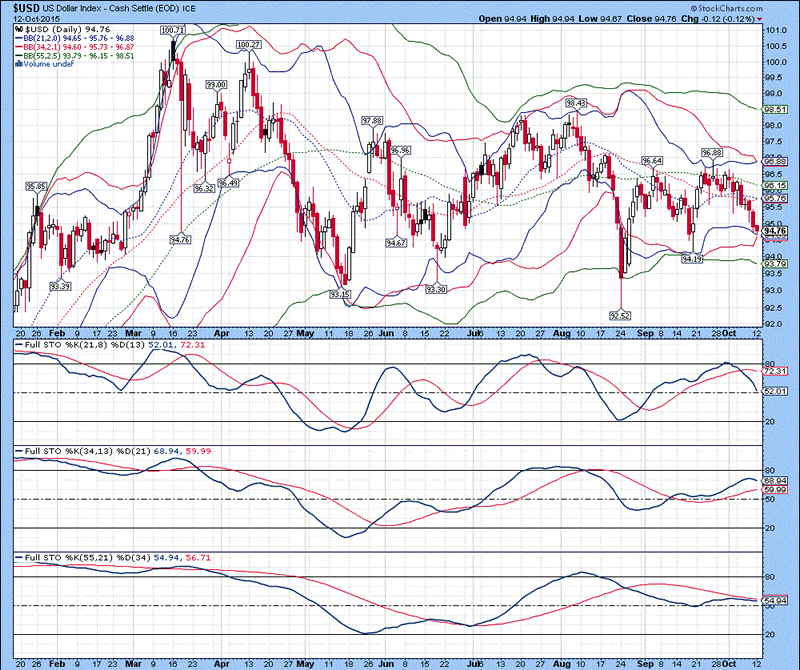
The daily chart of the US Dollar Index is shown below, with lower 21 and 34 MA Bollinger Bands in close proximity to each other with declining stochastics suggests further weakness in the US Dollar. Full stochastics 1, 2 and 3 are shown below in order of descent, with the %K beneath the %D in 1 and 3 and above the %D in 2. All of 2015 represents a huge sideways consolidation after the impulsive move that was put in place very early on this year. There is reasonable support between 93.5 and 94.0, so downside at this point in time appears restricted. With significant market weakness expected after rallying in the broad stock market indices occur, expect the decline to strengthen the US Dollar as liquidation ensues.
Figure 4
US Dollar Daily Chart
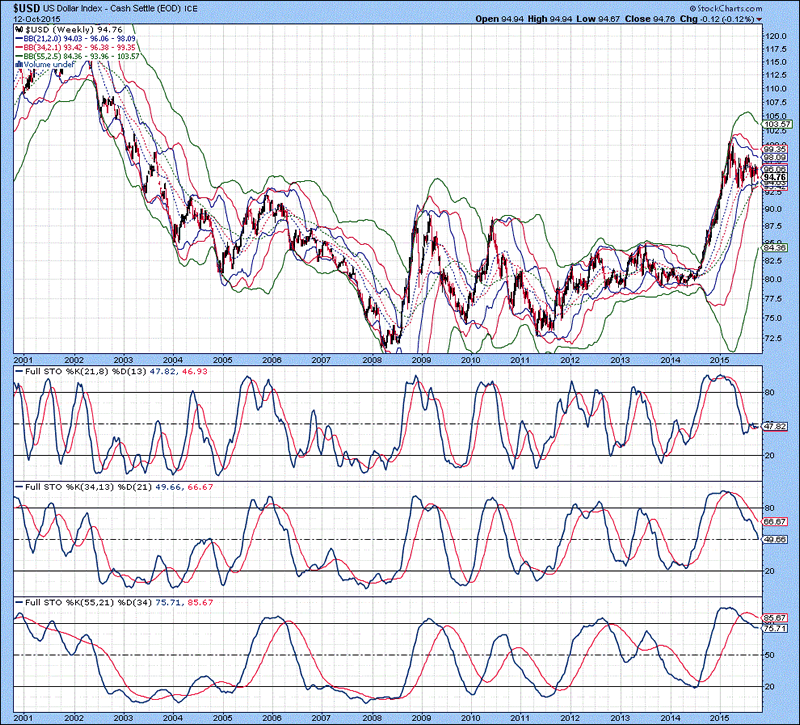
The weekly chart of the US Dollar Index is shown below, with the lower 55 MA Bollinger Band continuing to rise towards the sideways price action, suggests that at some point within the next 2-3 months enough of a reduction in space between the two bands will represent enough of a reduction in volatility to trigger the next leg up. Full stochastics 1, 2 and 3 are shown below in order of descent, with the %K marginally above the %D in 1 and beneath the %D in 2 and 3. The %K in stochastic 2 is still declining, with the price drifting sideways further supports the US Dollar continuing to drift sideways for up to 2-3 months before the next sharp move up commences.
Figure 5
US Dollar Weekly Chart
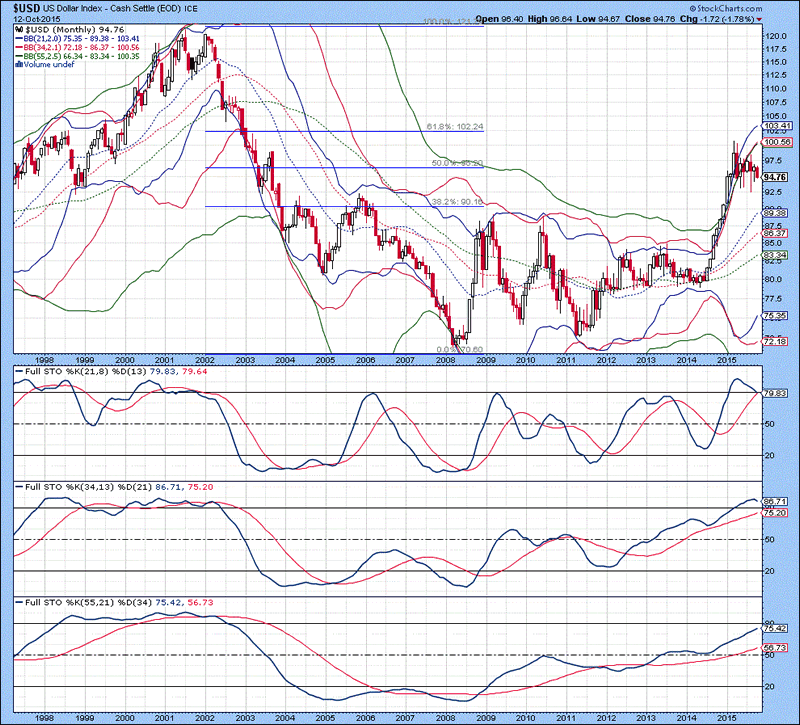
The monthly chart of the US Dollar Index is shown below, with the upper 21 MA Bollinger Band above the 34 and 55 MA Bollinger Bands suggests a very overbought condition remains in effect. Because of this one observation, it is entirely possible for the US Dollar to continue trading within a very narrow range for another 2-3 months before breaking higher. There is a huge gap between the lower and upper 55 MA Bollinger Bands, but if one looks back to 1998 to 2002, a very similar pattern was developing. As such, the US Dollar is not likely to hit a major high for at least 2-4 years from now. Full stochastics 1, 2 and 3 are shown below in order of descent, with the %K above the %D in all three instances. The stochastic setup closely resembles the 1998 to 2002 time frame, so it remains conclusive that another 2-3, maybe 4 months of continued sideways to downward price action continues before sharply reversing to the upside. As I have been stressing for the past year, the US Dollar is going to have far more strength than most expect and the coming move will pull even more surprises. Continue to be prudent with investments...the US Dollar longer term continues to be the safest investment.
Figure 6
US Dollar Monthly Chart
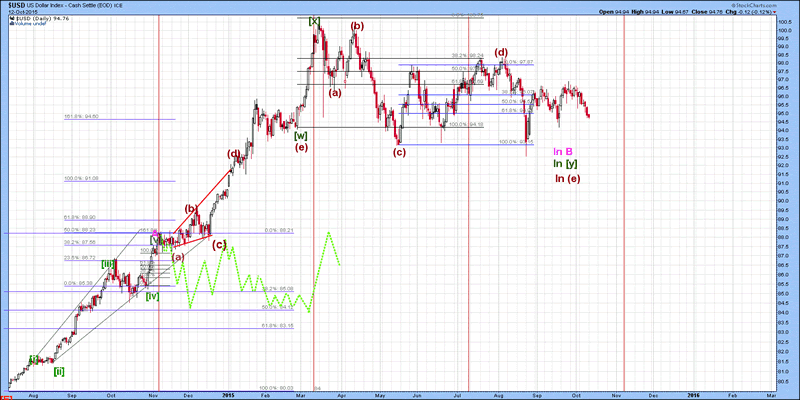
The short-term Elliott Wave count of the US Dollar Index is shown below, with wave A completing in November of 2014 as an impulsive pattern. The entire move from November until present is thought to be a part of a running correction pattern. At present, wave [y] is either completing a triangle, or is a double correction, with its final structure being a triangle. A longer-term alternative correction would be the (a)-(b)-(c) move of [y] being an elongated flat representing one segment of the 5 legged corrective structure. If this pattern were to be valid, then each subsequent move must take at least 2 months. This would put the earliest date of completion into February 2016, with the latest being around June 2016. I am leaning towards either of the first two scenarios, with another 2-3 months of sideways price action before moving higher. Since wave A was impulsive and wave B appears to be a running correction, wave C should be at least 1.618x the height of wave A, or 13 cents. Wherever the US Dollar bases at the end of this corrective pattern, slap 13 cents to the upside and that represents the minimum upside price objective.
Figure 7
US Dollar Daily Chart 2
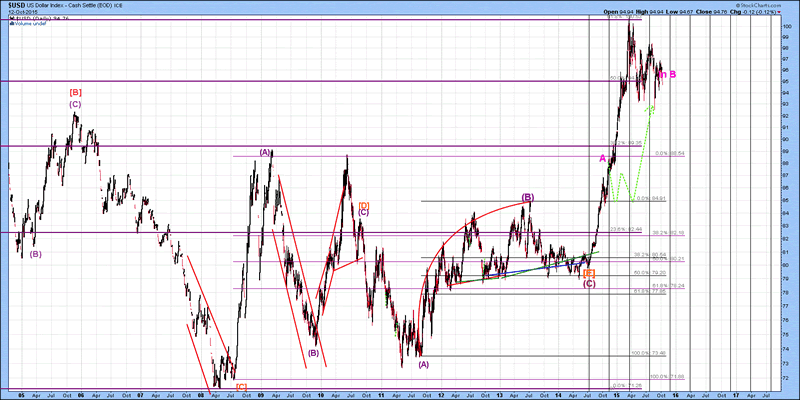
The mid-term Elliott Wave count of the US Dollar Index is shown below, with wave B thought to still be forming. When wave [E] completed in July 2014, it marked the end of a longer-term correction in the US Dollar and the start of a new bull market. Although the move up in the US Dollar exceeded above wave A, it is important to note that the lower Degree structure is purely impulsive above wave A. Implications for this requires wave C to also be impulsive in nature once wave B is complete, which as discussed earlier is probably 2-3 months from now. The consolidation phase of the US Dollar should be expected, based upon a net upward move of 21 cents within a 9 month period. One thing is for certain...there is at least one more leg higher in the US Dollar which will either complete the upward trend, or merely be a pause for another move higher. My thoughts are the US Dollar puts in a high between April and June 2016, followed by a 12-18 month correction before moving yet higher as it creates an ongoing currency crisis. Based upon this scenario, a top in the US Dollar Index occurs sometime between 2019 and 2021...I leave a window as I do not want to close it and lock into a date that cannot be foreseen...the trend however, should evolve as described. The present sideways price action in the US Dollar can be viewed as a bull flag, which still requires another 2-3 months of time before completion. Everything is moving under their own accord these days, so I am not even going to try and seek correlations between markets, because they can disappear as quickly as they were discovered. A weaker US Dollar has raised the price of oil and other commodities, which will weaken profitability of some mining companies...not much of a difference between $40 or $50 USD oil, but at the margin it can mean a lot. Be careful out there because these markets are extremely volatile.
Figure 8
US Dollar Daily Chart 3
That is all for today...back tomorrow AM. Have a great day.
By David Petch
http://www.treasurechests.info
I generally try to write at least one editorial per week, although typically not as long as this one. At www.treasurechests.info , once per week (with updates if required), I track the Amex Gold BUGS Index, AMEX Oil Index, US Dollar Index, 10 Year US Treasury Index and the S&P 500 Index using various forms of technical analysis, including Elliott Wave. Captain Hook the site proprietor writes 2-3 articles per week on the “big picture” by tying in recent market action with numerous index ratios, money supply, COT positions etc. We also cover some 60 plus stocks in the precious metals, energy and base metals categories (with a focus on stocks around our provinces).
With the above being just one example of how we go about identifying value for investors, if this is the kind of analysis you are looking for we invite you to visit our site and discover more about how our service can further aid in achieving your financial goals. In this regard, whether it's top down macro-analysis designed to assist in opinion shaping and investment policy, or analysis on specific opportunities in the precious metals and energy sectors believed to possess exceptional value, like mindedly at Treasure Chests we in turn strive to provide the best value possible. So again, pay us a visit and discover why a small investment on your part could pay you handsome rewards in the not too distant future.
And of course if you have any questions, comments, or criticisms regarding the above, please feel free to drop us a line . We very much enjoy hearing from you on these items.
Disclaimer: The above is a matter of opinion and is not intended as investment advice. Information and analysis above are derived from sources and utilizing methods believed reliable, but we cannot accept responsibility for any trading losses you may incur as a result of this analysis. Comments within the text should not be construed as specific recommendations to buy or sell securities. Individuals should consult with their broker and personal financial advisors before engaging in any trading activities as we are not registered brokers or advisors. Certain statements included herein may constitute "forward-looking statements" with the meaning of certain securities legislative measures. Such forward-looking statements involve known and unknown risks, uncertainties and other factors that may cause the actual results, performance or achievements of the above mentioned companies, and / or industry results, to be materially different from any future results, performance or achievements expressed or implied by such forward-looking statements. Do your own due diligence.
Copyright © 2015 treasurechests.info Inc. All rights reserved.
Unless otherwise indicated, all materials on these pages are copyrighted by treasurechests.info Inc. No part of these pages, either text or image may be used for any purpose other than personal use. Therefore, reproduction, modification, storage in a retrieval system or retransmission, in any form or by any means, electronic, mechanical or otherwise, for reasons other than personal use, is strictly prohibited without prior written permission.
David Petch Archive |
© 2005-2022 http://www.MarketOracle.co.uk - The Market Oracle is a FREE Daily Financial Markets Analysis & Forecasting online publication.