


Stock Market Primary V to New Highs Underway
Stock-Markets / Stock Markets 2015 Oct 10, 2015 - 05:36 PM GMTBy: Tony_Caldaro

 The week started at SPX 1951. After a gap up opening on Monday morning to start the week, the market made higher highs and lows every day ending the week at SPX 2015. For the week the SPX/DOW gained 3.5%, the NDX/NAZ gained 2.5%, and the DJ World index gained 4.4%. Economic reports for the week continued their neutral to negative bias. On the uptick: wholesale inventories, the WLEI, GDPn and weekly jobless claims improved. On the downtick: ISM services, consumer credit, export/import prices, the MMIS and the trade deficit expanded. Next week, a busy week, we get Industrial production, the FED’s Beige book, and Retail sales.
LONG TERM: bull market
We continue to count this six year bull market as Cycle wave [1] from the SPX 667 Super cycle low. Cycle wave bull markets unfold in five primary waves. Primary waves I and II completed in 2011, with Primary II taking the form of an elongated flat. Primary III completed in May 2015, and Primary IV probably completed at the August lows. If not, it will likely extend for a few more months, due to alternation, before it does complete. Primary V is now the main focus, because when it ends so does the bull market.
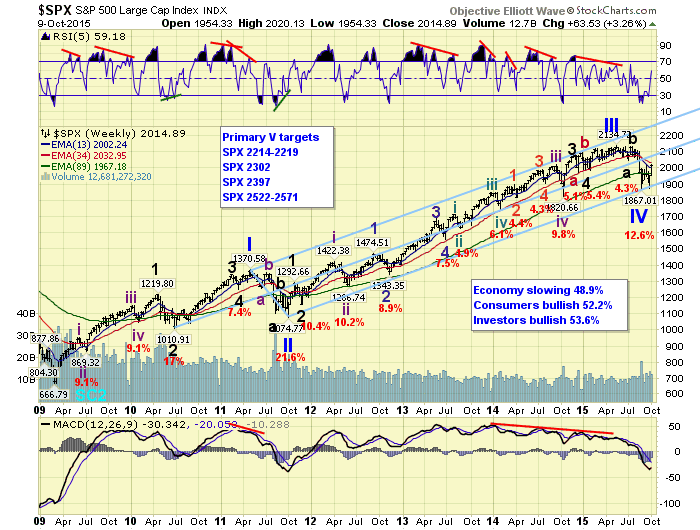
The day after the SPX 1872 retest of the August SPX 1867 low we posted two possible counts. Primary IV ended in August and Primary V is underway, (hourly/weekly charts), and Primary IV may still extend for a few months longer to satisfy P4 v P2 alternation, (daily chart). The deciding factor, as noted, would be determined by the current uptrend. Should the uptrend impulse higher Primary V is underway. If not, Primary IV continues. The current uptrend clearly appears to be impulsing. With the SPX 1867 low in mind we posted some potential targets for Primary V. They are noted on the weekly chart above.
MEDIUM TERM: uptrend
The main advantage of OEW over EW is that it quantifies all medium and long term waves. We can’t just place a label on the weekly chart because it looks right. We can only place labels where there are actual, quantified, turning points. This does not mean we always know where the market is heading in advance. No one does. What it does provide is a view of the most obvious future path of the market medium and long term.
Just after the late-September SPX 1872 retest of the low OEW confirmed an uptrend. As noted in the previous section, this suggested two possible paths. We somewhat favored the Primary IV low in late-August, because this would satisfy the P4 v P2 alternation now. This is why we posted that count on the hourly/weekly chart. Despite the mixed signals from other indices and indicators, the DOW/NDX/NAZ clearly displayed the potential for the low in August.
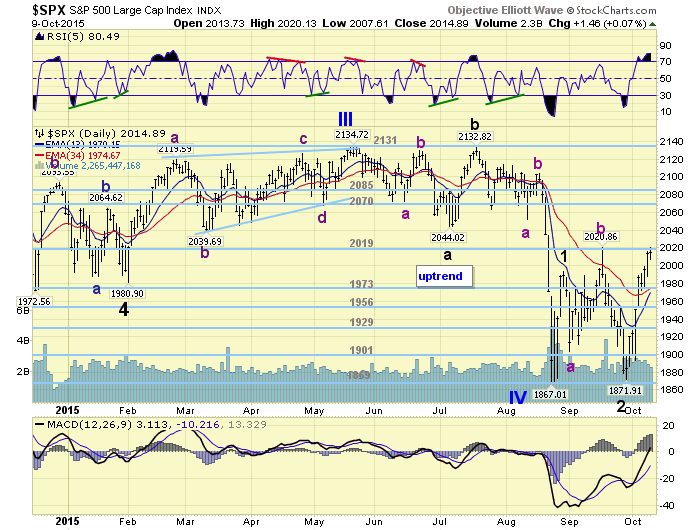
Since this uptrend had quite an odd, and somewhat confusing, beginning we will explain the count. From the SPX 1867 low the market rallied quickly in five waves: 1915-1880-1990-1948-1993. We had labeled this Major wave 1. Then Major 2 went into a long extended corrective pattern: 1903-2021-1872. We labeled this as an irregular zigzag. Does it look right? No. But that is the pattern the market presented.
When the market started to rally off the SPX 1872 low it started off with a similar irregular pattern, but on a much smaller scale. The market rallied to SPX 1917, then did an irregular flat for the pullback: 1897-1927-1894. After that it advanced to SPX 1992-1972-1999 by Wednesday this week, completing another five waves up. Clearly this uptrend is looking impulsive. More on this below. Medium term support is at the 1973 and 1956 pivots, with resistance at the 2019 and 2070 pivots.
SHORT TERM
With Major wave 1 @ SPX 1993 and Major 2 @ SPX 1872, Major wave 3 has been underway. Thus far we can count five waves up from SPX 1872: 1917-1894-1992-1974-1999. We have labeled this Int. i of Major 3. Then we labeled the pullback to SPX 1976 as Int. ii. Intermediate wave iii should now be underway from that low. When it completes, there will be an Int. iv pullback, then an Int. v rally to complete Major wave 3. We will count the waves, and note them on the daily updates as the uptrend unfolds. Thus far Int. iii has rallied to SPX 2020 in just one wave from the SPX 1976 Int. ii low. There should be five waves up before it concludes.
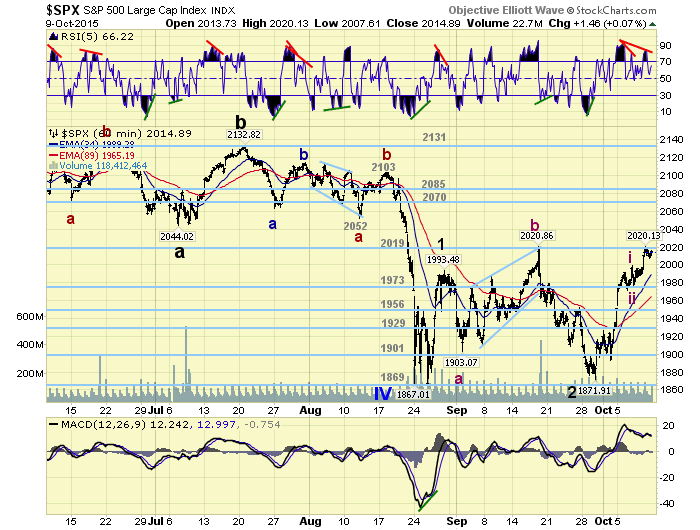
Short term support is at SPX 2000 and the 1973 pivot, with resistance at the 2019 pivot and SPX 2040. Short term momentum ended the week just above neutral. Best to your trading!
FOREIGN MARKETS
The Asian markets were all higher and gained 5.3%.
European markets were all higher and gained 5.0%.
The Commodity equity group were all higher too and gained 8.4%.
The DJ World index is uptrending and gained 4.4%.
COMMODITIES
Bonds remain in an uptrend but lost 0.7% on the week.
Crude is uptrending and gained 8.7% on the week.
Gold is uptrending and gained 1.6% on the week.
The USD is also in an uptrend but lost 1.1% on the week.
NEXT WEEK
Monday: a speech from FED governor Brainard after the close. Tuesday: Budget surplus. Wednesday: the PPI, Retail sales, Business inventories and the FED’s Beige book. Thursday: weekly Jobless claims, the CPI, and the NY/Philly FED. Friday: Industrial production and Consumer sentiment. Best to your weekend and week!
CHARTS: http://stockcharts.com/public/1269446/tenpp
After about 40 years of investing in the markets one learns that the markets are constantly changing, not only in price, but in what drives the markets. In the 1960s, the Nifty Fifty were the leaders of the stock market. In the 1970s, stock selection using Technical Analysis was important, as the market stayed with a trading range for the entire decade. In the 1980s, the market finally broke out of it doldrums, as the DOW broke through 1100 in 1982, and launched the greatest bull market on record.
Sharing is an important aspect of a life. Over 100 people have joined our group, from all walks of life, covering twenty three countries across the globe. It's been the most fun I have ever had in the market. Sharing uncommon knowledge, with investors. In hope of aiding them in finding their financial independence.
Copyright © 2015 Tony Caldaro - All Rights Reserved Disclaimer: The above is a matter of opinion provided for general information purposes only and is not intended as investment advice. Information and analysis above are derived from sources and utilising methods believed to be reliable, but we cannot accept responsibility for any losses you may incur as a result of this analysis. Individuals should consult with their personal financial advisors.
Tony Caldaro Archive |
© 2005-2022 http://www.MarketOracle.co.uk - The Market Oracle is a FREE Daily Financial Markets Analysis & Forecasting online publication.