Target Date Funds As Aid In Retirement Investment Portfolio Design
Portfolio / Pensions & Retirement Oct 06, 2015 - 10:23 AM GMTBy: Richard_Shaw
 Investors in or near retirement should be aware of portfolio design leading fund sponsors suggest as appropriate
- Leading target date funds appear to generally have less severe worst drawdowns than a US 60/40 balanced fund
- The funds have slightly higher yields than a US 60/40 balanced fund
- Target date funds have underperformed a US 60/40 balanced fund in part due to a cash reserve component and non-US stocks
- Non-US stocks drag on historical performance could become future boost to performance.
Intended Audience
This article is suitable for investors who are in retirement or nearly so, and who are or will rely heavily on their portfolio to support lifestyle.
It is not suitable for those with many years to retirement, or those with a lot more money in their portfolio than they will need to support their lifestyle.
Short-term and Long-term
We have been writing about the short-term recently (here and here and here), because we are in a Correction, that may become a severe Correction, and possibly a Bear.
For our clients who fit the profile of being in or near retirement and heavily dependent of their portfolio to support lifestyle in retirement, we have tactically increased cash in the build-up to and within this Correction, as breadth and other technical have deteriorated.
However, we don't want to lose sight of long-term strategic investment. This article is about asset allocation for investors that fit that retirement, pre-retirement, portfolio dependence profile.
Where to Begin Allocation Thinking
We think it is a good idea to begin thinking about allocation by:
- reviewing the history of simple risk levels (see our homepage) from very conservative to very aggressive to get a sense of where you would have been comfortable
- reviewing what respected teams of professionals at leading fund families believe is appropriate based on years to retirement (they assume generic investor without differentiated circumstances).
This article is about the second of those two important review -- basically looking at what are called "target date" funds.
Generally, portfolios should have a long-term strategic core, and may have an additional tactical component. We think some combination of risk level portfolio selection and/or target date portfolio selection can make a suitable portfolio for many investors.
You may or may not want to follow target date allocations, but you would be well advised to be aware of the portfolio models as you develop your own.
In effect, we would suggest using risk level models and target date models as a starting point from which you may decide to build and deviate according to your needs and preferences, but with the assumption that the target date models are based on informed attempts at long-term balance of return and risk appropriate for each stage of financial life.
For example, an investor might deviate one way or the other from more aggressive to less aggressive based on the size of their portfolio relative to what they need to support their lifestyle, and the size of non-portfolio related income sources; or merely their emotional comfort level with portfolio volatility.
There no precise allocation that is certain to be best, which is revealed by the variation in models among leading target date fund sponsors. Their allocations are different, but similar in most respects.
Fund Family Selection
For this article, we identified the 7 fund families with high Morningstar analyst ratings for future performance (those ranked Gold and Silver, excluding those ranked Bronze, Neutral or Not Rated).
Those 7 families are:
- Fidelity
- Vanguard
- T. Rowe Price
- American Funds
- Black Rock
- JP Morgan
- MFS
Fidelity, Vanguard and T. Rowe Price have about 75% of the assets in all target date funds from all sponsoring families combined.
Asset Categories Considered
We then used Morningstar's consolidated summary of their detailed holdings to present and compare the target date funds from each family. The holdings were summarized into:
- Net Cash
- Net US Stocks
- Net Non-US Stocks
- Net Bonds
- Other
While we have gathered that data for retirement target dates out 30 years. This article is just about target date funds for those now in retirement or within 5 years of retirement.
Proxy Investment Funds Used
We simulated the hypothetical past performance of those target date funds using these Vanguard funds:
- VMMXX (money market)
- VTSAX (total US stocks)
- VGSTX (total non-US stocks)
- VBLTX (aggregate US bonds)
Admittedly, this is a gross proxy summary of the holdings of the subject target date funds The funds may hold individual stocks or bonds, may hold international bonds, may use some derivatives, and may have some short cash or short equities. Nonetheless, we think these Vanguard funds are good enough to serve as a proxy for the average target date funds, and as a baseline model for you to examine target date funds and to plan your own allocation.
The Benchmark
As a benchmark for each allocation, we chose the Vanguard Balanced fund which is 60% US stocks/40% US bonds index fund. Figure 1 shows the best and worst periods over the last 10 years for that fund, as well as its current trailing yield.
Figure 1:

So, let's keep the 2.10% yield in mind as we look at the models, and also the 19.7% 3-month worst drawdown, the 27.6% worst annual drawdown, and 7.3% worst 3-year drawdown.
For Those Currently Retired
Figure 2 shows the allocation from each of the fund families for those currently in retirement. It also averages their allocations for all 7 and for the top three (Fidelity, Vanguard, T. Rowe Price).

You will note substantial ranges for allocations from fund family to fund family. For example, MFS using about 19% US stocks while Fidelity uses about 38%; and MFS uses about 64% bonds and Fidelity uses about 36%.
The average bond allocation for the 7 families is about 54%, but the top three by assets average about 42%; and their average cash allocation is about 9% versus the top 3 average of 5%.
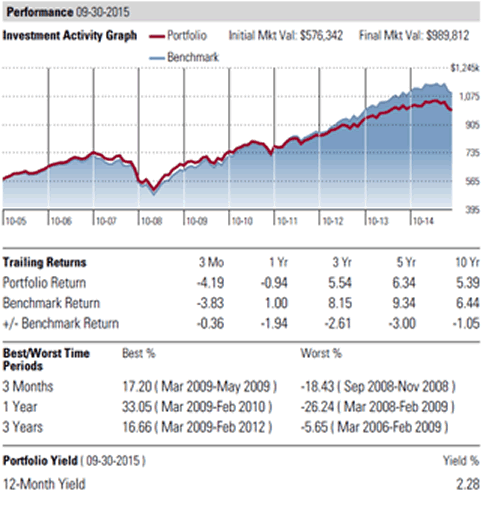
Figure 3 shows how a portfolio using Vanguard index funds would have performed over the past 10 years with monthly rebalancing if it was based on the average of the top 3 families.
We recalculated the allocations to exclude "Other" which is undefined, but which is relatively minor in size in each fund.
We also note that the Vanguard index funds have a small cash component, so that the effective cash allocation is higher than the model.
Figure 3 - Backtest Performance:
(retired now: average of top 3 families)
Observations:
- Yield is somewhat higher (2.28% versus 2.10%).
- Worst 3 months were somewhat better (-18.4% versus - 19.7%)
- Worst 1 year was somewhat better (-26.2% versus -27.6%)
- Worst 3 year drawdown was better (-5.7% versus -7.3%)
- Underperformed benchmark over 10, 5, 3 and 1 year and 3 months (10 years underperformed by annualized 1.05%).
Reasons For Underperformance
Inclusion of non-US equities may be the biggest contributor to underperformance versus the balanced fund with 100% US securities.
Another part of the underperformance is maintenance of a cash reserve position that is over and above any cash position within the benchmark balanced fund. Part is also due to a higher bond allocation.
Those factors probably account most of the performance difference. We did not try to determine the exact contributions of each attribute to performance differences.
The historical underperformance due to non-US stocks could possibly turn out to be a long-term reason for future outperformance.
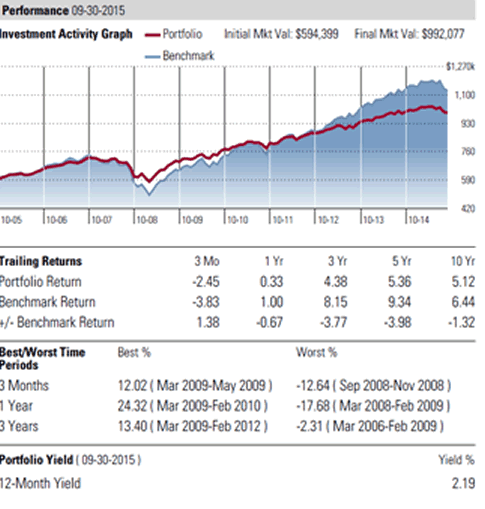
Figure 4 - Backtest Performance:
(retired now: average of top 7 families)
Observations:
- Yield is somewhat higher (2.19% versus 2.10%).
- Worst 3 months were significantly better (-12.6% versus - 19.7%)
- Worst 1 year was somewhat better (-17.7% versus -27.6%)
- Worst 3 year drawdown was a lot better (-2.3% versus -7.3%)
- Underperformed benchmark over 10, 5, 3 and 1 year & outperformed over the last 3 months (10 years underperformed by annualized 1.32%).
- Incurred less drawdown in exchange for lower cumulative return.
For Those Expecting to Retire Within 5 Years
Figure 5 - Allocation:
(expected retirement within 5 years)

Again, we see substantial variation between fund families, and also between the averages for the top 3 by assets and for all 7 of the Gold or Silver rated target date families.
The average bond allocation for the 7 families is about 44%, but for the top 3 it is only about 34%. For the 7 families the average non-US stocks are about 15%, but for the top 3 families it is about 21%.
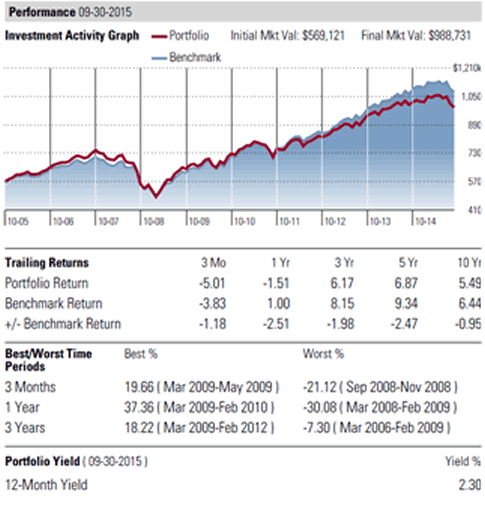
Figure 6 - Backtest Performance:
(up to 5 years to retirement: average of top 3 families)
Observations:
- Yield is higher (2.30% versus 2.10%).
- Worst 3 months were somewhat worse (-21.1% versus - 19.7%)
- Worst 1 year was somewhat worse (-30.1% versus -27.6%)
- Worst 3 year drawdown was the same (-7.3% versus -7.3%)
- Underperformed benchmark over 10, 5, 3 and 1 year and 3 months (10 years underperformed by annualized 0.95%).
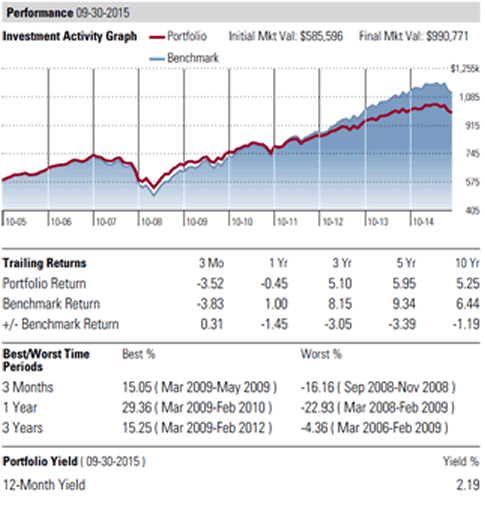
Figure 7 - Backtest Performance:
(up to 5 years to retirement: average of top 7 families)
Observations:
- Yield is somewhat higher (2.19% versus 2.10%).
- Worst 3 months were better (-16.2% versus - 19.7%)
- Worst 1 year was better (-22.9% versus -27.6%)
- Worst 3 year drawdown was better (-4.4% versus -7.3%)
- Underperformed benchmark over 10, 5, 3 and 1 year & slightly outperformed over the last 3 months (10 years underperformed by annualized 1.19%).
Performance of Individual Proxy Funds
Figure 8 presents the current yield and rolling returns of the five individual proxy funds used in this review.
Figure 8:

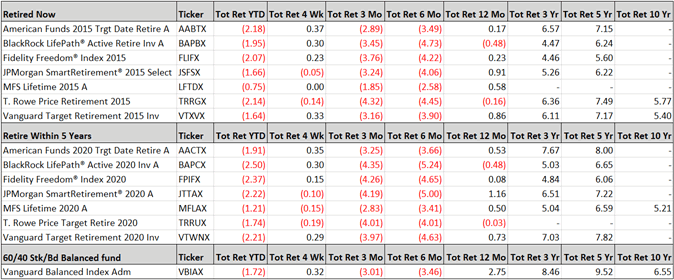
Performance of the Target Date Funds
Figure 9:
By Richard Shaw
http://www.qvmgroup.com
Richard Shaw leads the QVM team as President of QVM Group. Richard has extensive investment industry experience including serving on the board of directors of two large investment management companies, including Aberdeen Asset Management (listed London Stock Exchange) and as a charter investor and director of Lending Tree ( download short professional profile ). He provides portfolio design and management services to individual and corporate clients. He also edits the QVM investment blog. His writings are generally republished by SeekingAlpha and Reuters and are linked to sites such as Kiplinger and Yahoo Finance and other sites. He is a 1970 graduate of Dartmouth College.
Copyright 2006-2015 by QVM Group LLC All rights reserved.
Disclaimer: The above is a matter of opinion and is not intended as investment advice. Information and analysis above are derived from sources and utilizing methods believed reliable, but we cannot accept responsibility for any trading losses you may incur as a result of this analysis. Do your own due diligence.
Richard Shaw Archive |
© 2005-2022 http://www.MarketOracle.co.uk - The Market Oracle is a FREE Daily Financial Markets Analysis & Forecasting online publication.


