Elliot Wave Analysis of Long Term SPX Stock Market Chart
Stock-Markets / Elliott Wave Theory Sep 25, 2015 - 01:14 PM GMTBy: Submissions
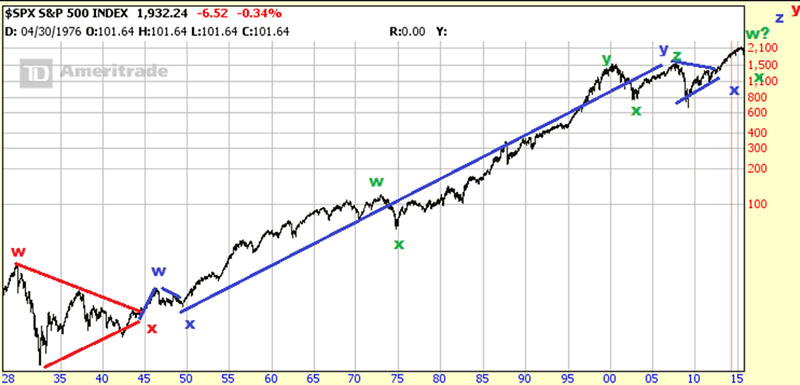
Imad Ahmed writes: An Elliot Wave analysis of the long term SPX chart provides some guidance on where the markets may be heading over the next few months.
If this multiyear rally has finally topped, what we should be seeing next is a confirmation of the location of the blue X below.

Considering this X needs to line up with a similar pattern in the SPY chart (which has significantly outperformed SPX), the target for Green x will be at minimum in the SPX 1250 range.
There is no way to be sure the rally is over yet although we’re not seeing the same behavior in the markets as during the rally.
Imad Ahmed
© 2015 Copyright Imad Ahmed - All Rights Reserved
Disclaimer: The above is a matter of opinion provided for general information purposes only and is not intended as investment advice. Information and analysis above are derived from sources and utilising methods believed to be reliable, but we cannot accept responsibility for any losses you may incur as a result of this analysis. Individuals should consult with their personal financial advisors.
© 2005-2022 http://www.MarketOracle.co.uk - The Market Oracle is a FREE Daily Financial Markets Analysis & Forecasting online publication.


