S&P 500 Stock Market Index Approaching Critical Test of March Low
Stock-Markets / Stocks Bear Market Jun 26, 2008 - 06:47 PM GMTBy: Mike_Paulenoff

 The relentless selling pressure that has transpired since about 3 PM ET
yesterday (Wednesday) despite some intense oversold readings and developing
momentum divergences has started to convince me that the near-term chart
work in the S&P 500, though still extremely important, may not be calling
the directional shots any longer. In fact, the developing negativity of the
very long term technical work may be the timeframe that IS CALLING -- and
will continue to call -- the directional shots for the foreseeable future.
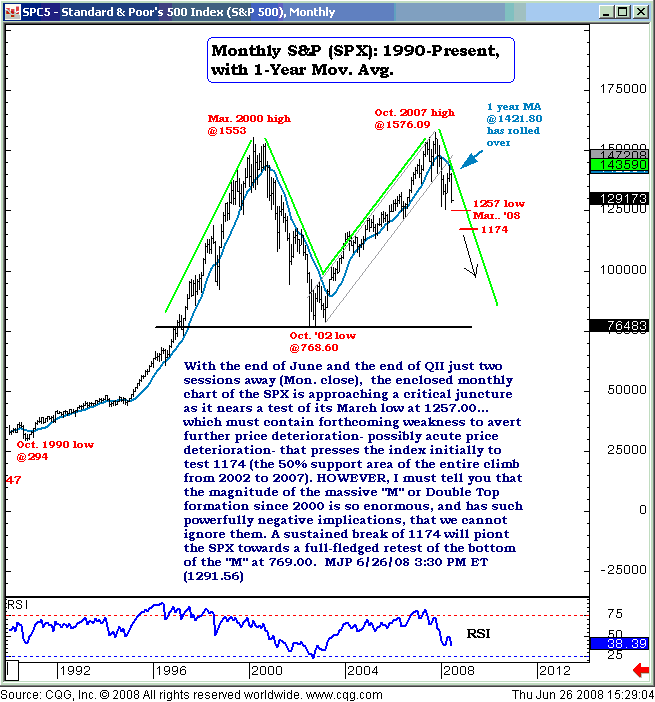
I really don't know with 100% certainty if that IS the case right here, right now. But it remains a growing, and dominant factor in my analysis, and something that will govern my perceptions going forward, especially if the SPX violates and sustains beneath 1257 (just 2.5% away).
With the end of June and the end of Q2 just two sessions away (Monday close), the enclosed monthly chart of the S&P 500 is approaching a critical juncture as it nears a test of its March low at 1257.00Šwhich must contain forthcoming weakness in order to avert further price deterioration, possibly acute price deterioration, that presses the index initially to test 1174 (the 50% support area of the entire climb from 2002 to 2007).
However, I must tell you that the magnitude of the massive "M" or double-top formation since 2000 is so enormous and has such powerfully negative implications that we cannot ignore them. A sustained break of 1174 will point the SPX towards a full-fledged retest of the bottom of the "M" at 769.00.

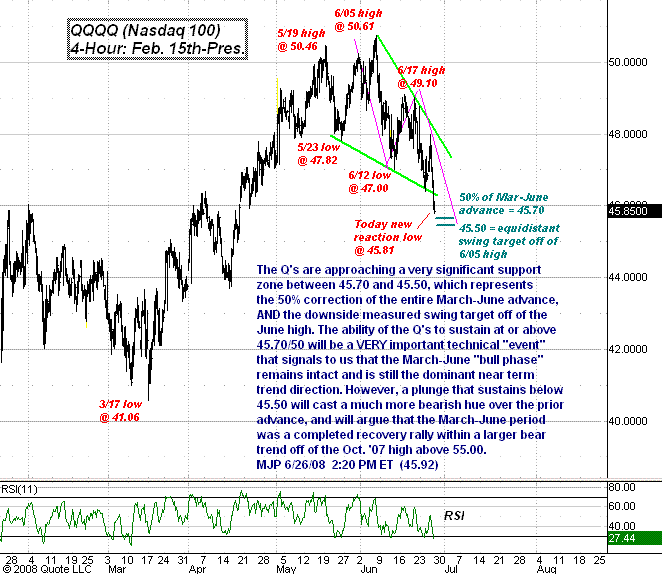
Moving over to the Qs, the QQQQ are approaching a very significant support zone between 45.70 and 45.50, which represents the 50% correction of the entire March-June advance AND the downside measured swing target off of the June high. The ability of the Q's to sustain at or above 45.70/50 will be a VERY important technical "event" that signals to us that the March-June "bull phase" remains intact and is still the dominant near-term trend direction.
However, a plunge that sustains below 45.50 will cast a much more bearish hue over the prior advance and will argue that the March-June period was a completed recovery rally within a larger bear trend off of the October 2007 high above 55.00.

Sign up for a free 15-day trial to Mike's ETF Trading Diary today.
By Mike Paulenoff
Mike Paulenoff is author of the MPTrader.com (www.mptrader.com) , a real-time diary of Mike Paulenoff's trading ideas and technical chart analysis of Exchange Traded Funds (ETFs) that track equity indices, metals, energy commodities, currencies, Treasuries, and other markets. It is for traders with a 3-30 day time horizon, who use the service for guidance on both specific trades as well as general market direction
© 2002-2007 MPTrader.com, an AdviceTrade publication. All rights reserved. Any publication, distribution, retransmission or reproduction of information or data contained on this Web site without written consent from MPTrader is prohibited. See our disclaimer.
Mike Paulenoff Archive |
© 2005-2022 http://www.MarketOracle.co.uk - The Market Oracle is a FREE Daily Financial Markets Analysis & Forecasting online publication.


