Stock Market Triangle within a Triangle
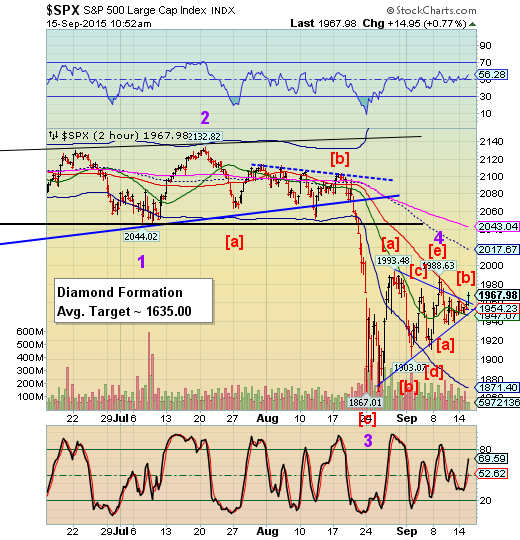
Stock-Markets / Stock Markets 2015 Sep 15, 2015 - 05:16 PM GMT Keeping in mind that the Minor Waves of Intermediate Wave (1) are in an [a]-[b]-[c] form, I had wondered how the next Wave [b] would look. Here’s our answer. It appears to be yet another Triangle with a smaller degree throw-over Wave (e). There is no guarantee that it is finished yet. We may have confirmation when we see a five-wave [c] emerge out of the bottom of the triangle at 1954.00. Note the very light volume in this ramp. Volume should pick up substantially on the decline. This has a similar feel

The question is, how fast the decline? If we see a sharp decline (flash crash) to a new low by Thursday, then this Wave structure would hold true and that would be the Master Cycle low instead of August 24. The next Master Cycle low is due on or near October 19. The possibility of the new decline extending past this week would make it a candidate for next month’s Master Cycle low.
Having a double Triangle within the same general trendlines is a curiosity that we won’t see again in a very long time.
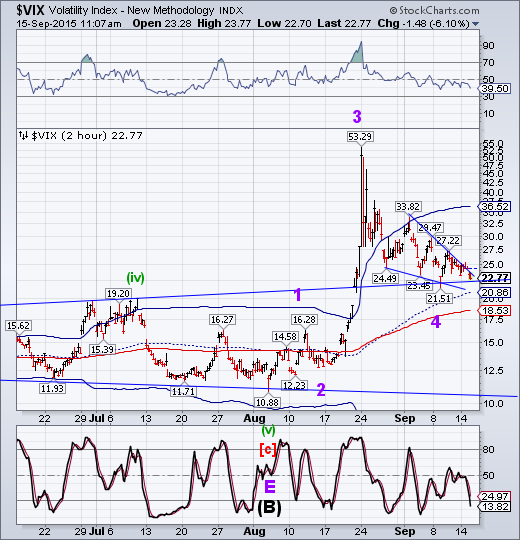
The September 9 low at 21.51 appears to be holding, suggesting that a new rally may have already begun in the VIX. The Broadening Bottom trendline also seems to be providing support.

ZeroHedge reports, “The VIX term structure has been inverted (spot higher than 3rd futures) for 17 days - that is the longest period of backwardation since August 2011, when uncertainty soared around the USA credit rating downgrade. In fact,much of the VIX term structure is higher today than it was at the peak of the crisis on Black Monday as both government shutdown and Fed rate hike fears dominate the forward curve...
The longest streak of VIX curve inversion since the USA credit rating downgrade in 2011...”
This backwardation must be resolved soon. Either it suggests a flash crash is imminent or it may continue through October.
The rally may be signaled by the VIX rising above its trendline at 24.00.
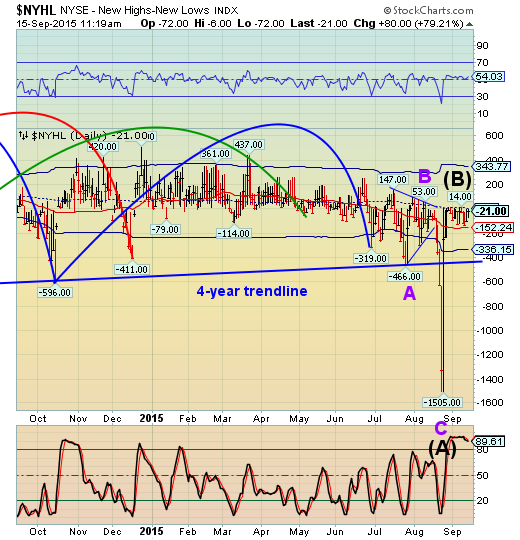
The Hi-Lo Index continues to remain beneath its mid-Cycle resistance. Any decline from hare may be quite substantial.

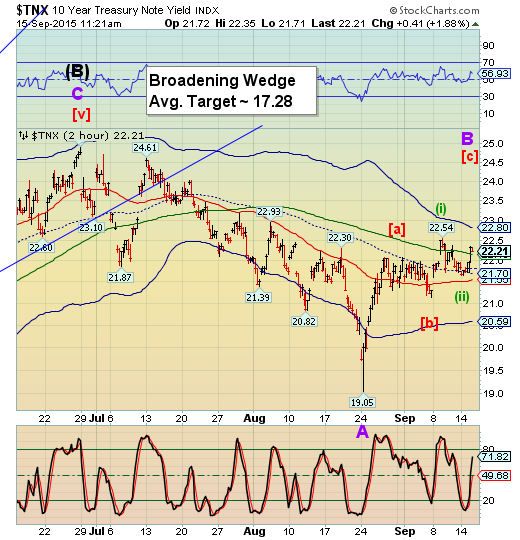
TNX has broken above its 50-day Moving Average, putting stress on the bond market. TYX is above 30.00, crossing a critical resistance area as well. This is reaching a critical state with the next Pivot due tomorrow and the one following on Friday.

Regards,
Tony
Our Investment Advisor Registration is on the Web
We are in the process of updating our website at www.thepracticalinvestor.com to have more information on our services. Log on and click on Advisor Registration to get more details.
If you are a client or wish to become one, please make an appointment to discuss our investment strategies by calling Connie or Tony at (517) 699-1554, ext 10 or 11. Or e-mail us at tpi@thepracticalinvestor.com .
Anthony M. Cherniawski, President and CIO http://www.thepracticalinvestor.com
As a State Registered Investment Advisor, The Practical Investor (TPI) manages private client investment portfolios using a proprietary investment strategy created by Chief Investment Officer Tony Cherniawski. Throughout 2000-01, when many investors felt the pain of double digit market losses, TPI successfully navigated the choppy investment waters, creating a profit for our private investment clients. With a focus on preserving assets and capitalizing on opportunities, TPI clients benefited greatly from the TPI strategies, allowing them to stay on track with their life goals
Disclaimer: The content in this article is written for educational and informational purposes only. There is no offer or recommendation to buy or sell any security and no information contained here should be interpreted or construed as investment advice. Do you own due diligence as the information in this article is the opinion of Anthony M. Cherniawski and subject to change without notice.
Anthony M. Cherniawski Archive |
© 2005-2022 http://www.MarketOracle.co.uk - The Market Oracle is a FREE Daily Financial Markets Analysis & Forecasting online publication.


