US and UK Housing Market Trend Forecasts
News_Letter / Global Housing Markets Sep 15, 2015 - 04:32 AM GMTBy: NewsLetter
 The Market Oracle Newsletter June 5th, 2015 Issue # 10 Vol. 9
US and UK Housing Market Trend Forecasts
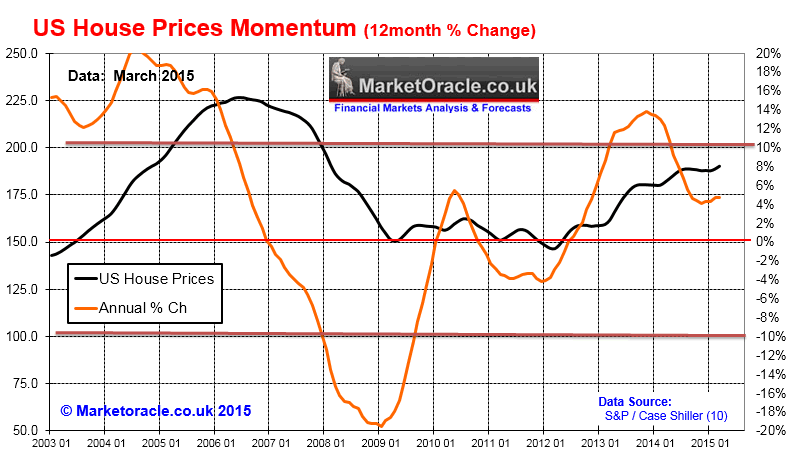
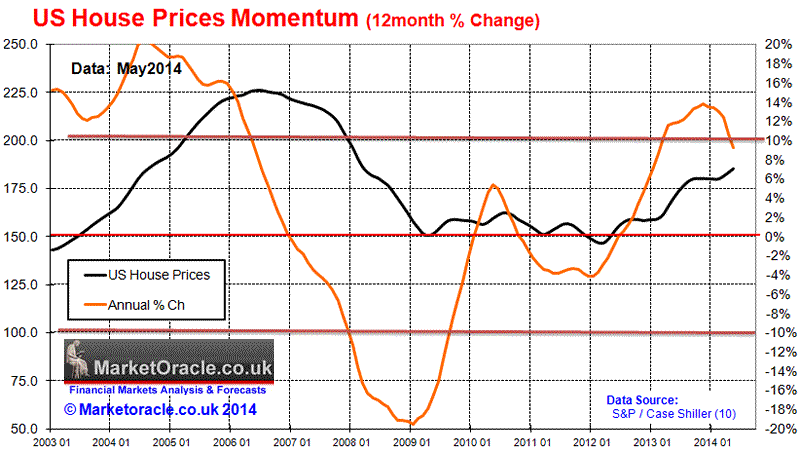
Dear Reader, The most recent release of US House prices data for March 2015 (Case Shiller 10 City Composite) which despite rising by 0.8% on the month nevertheless continues to maintain a trend for the erosion of annual pace for house price inflation that remains below 5%, far lower than that of a year ago when US house prices were galloping ahead at near 14% per annum as illustrated by the momentum graph.
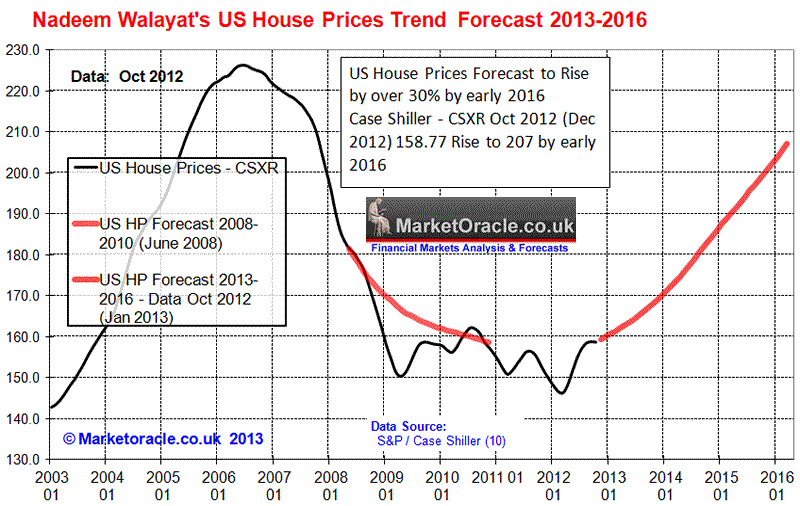
US Interest Rates Panic The pundits in the mainstream press have taken the slowdown as further sign for the imminent demise of the US housing bull market by latching onto the likes of Saudi Arabia's war on the US shale oil industry resulting in an economic slowdown or that the Fed surely must soon start to raise interest rates which is ignorant of the reality that central bankers will only raise interest rates when they are forced to do so by the markets, namely to prevent a wage price spiral, support a plunging currency and to halt a bond market panic, all of which are crisis events rather than one of central bankers signaling orderly intentions, as it should not be forgotten that zero interest rates are a PANIC measure. Therefore contrary to the Fed's pronouncements, Fed policy remains in PANIC MODE, which means it will only be a greater panic that prompts actions to raise interest rates. Again, I need to emphasis the point that interest rates since late 2008 have been in PANIC MODE, there is nothing normal about zero interest rates / negative real bond yields, and so the prospects for interest rate hikes should be viewed on as a result of a reaction to a greater panic for there is no free lunch as you cannot PRINT ECONOMIC GROWTH! Therefore you can forget ALL of the noise in the mainstream press of the Fed RAISING US Interest rates because it is more probable that the Fed will CUT interest rates or likely manifesting itself in MORE QE i.e. the exact OPPOSITE of that which the mainstream press has been obsessing over for the whole of this year. Remember you heard it hear first that the Fed is more likely to LOOSEN Monetary Policy than TIGHTEN! The Times - 4th June 2015 - US homeowners 'should expect fall in property prices'American homeowners who are struggling to make up for value lost during the financial crisis can expect recent gains in property prices to reverse... Where house prices are concerned, rather than listing a long series of pronouncements from those who in large part will be unknown market commentators, I will once more just list the utterances from the widely recognised King of U.S. housing market data, Prof. Robert Shiller who once more recently warned not just against high housing market valuations but also for stocks, a bull market which he neither saw coming and has been caught on the wrong side of for many years. Rate hike needed to pop bubbles: Robert Shiller - 1st June 2015 The U.S. Federal Reserve should consider lifting interest rates sooner rather than later to tackle speculative bubbles in the housing and stock markets, Nobel Prize-winning economist Robert Shiller told CNBC on Monday. "I'm thinking they (Fed policy makers) ought to be considering that, because that is the mistake they made in the past," the Yale University professor told CNBC Europe's "Squawk Box" when asked whether he believed the Fed should raise interest rates soon or later on. "They didn't deal with the housing bubble that led to the present crisis. There's a suggestion in my mind that they should be raising rates now, (but) unfortunately the latest news looks a little weak on the demand side," Shiller added. To further illustrate the point, Robert Shiller's current comments are pretty much the same as he was stating a year ago - “How can it be that people think we can’t get a riskless return in real terms for 30 years? There’s something bizarre. That looks a little bit like a bubble as well. So the whole thing might correct—both bonds and stocks,” Shiller said. Shiller said he’s also been “kind of surprised” by the housing market, which is up around 25% since the 2009 low (and even more in some cities). So what do academics such as Robert Shiller repeatedly miss ? They miss the significance of MOMENTUM and SENTIMENT on TREND which is ACCUMULATIVE as I have covered many times over many years. 19 Aug 2013 - UK House Prices Bull Market Soaring Momentum What Academics and Journalists Will Never Understand About Markets In having immersed by myself in the markets for 30 years now, I know that what many academics tend to take for granted rarely matches reality. Whilst I covered many aspects of trading markets in my last ebook (Stocks Stealth Bull Market 2013 and Beyond - Free Download). However in terms of economic trends what academics will always fail to grasp is that markets are NOT driven by fundamentals but by SENTIMENT and it is SENTIMENT that CREATES the fundamentals! Which is why the academic economists rarely have any real clue as to what is going in the markets because they are nearly always looking in the WRONG direction i.e. they are looking at the CAUSE rather than the EFFECT, as in reality it is the EFFECT that makes itself manifest in the price charts long before the CAUSE appears in the economic data that academics focus upon, which is why the SAME economic data can and is used by economists and pseudo-economist (journalists) such as that which we see on TV news shows to explain EITHER price rises OR falls. You can only know the markets IF you TRADE the markets! The pseudo and academics economists will never get you on the right side of trends years ahead of the herd, in fact most press media commentators will be some of the LAST people to jump onboard trends, usually just before they end! Momentum Drives Housing Market Sentiment and Economic Growth As house price rises continue to accelerate, many people sat on the sidelines waiting for prices to fall or even crash will realise that it is just not going to happen, and in their despair at the relentless accelerating trend of rising prices, in increasing numbers will feel no choice but to jump onboard the housing bull market as a they see the houses they have been viewing sold and asking prices trending ever higher. As house prices rise, home owners see the value of their houses rise £x thousands per month, in many cases by more than their salaries, this will encourage many to borrow and spend more, and save less which will meet the governments primary objective for inflating the economy by means of the housing market. Everyone will be playing the game of how much has my house value increased by, a quick analysis of my own housing portfolio (based in Zoopla estimates) shows a 5.5% increase in housing wealth over just the past 6 months! Does this make me feel richer, more willing to spend? Well, being only human, YES it does! So enough of the academic noise and the mainstream press that tends to regurgitate academic theories and sales pitches from the financial industry, instead here is my real take on the current state of the U.S. housing market in terms of PRICE, for at the end of the day all that matters is what the PRICE is doing. U.S. House Prices Trend Forecast 2013-2016 My long standing forecast for US house prices covering the period November 2012 to early 2016 is now entering its final leg as excerpted below: 12 Jan 2013 - U.S. Housing Real Estate Market House Prices Trend Forecast 2013 to 2016)
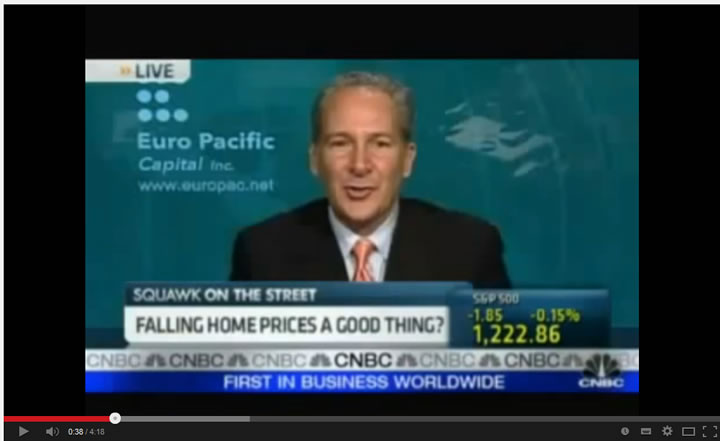
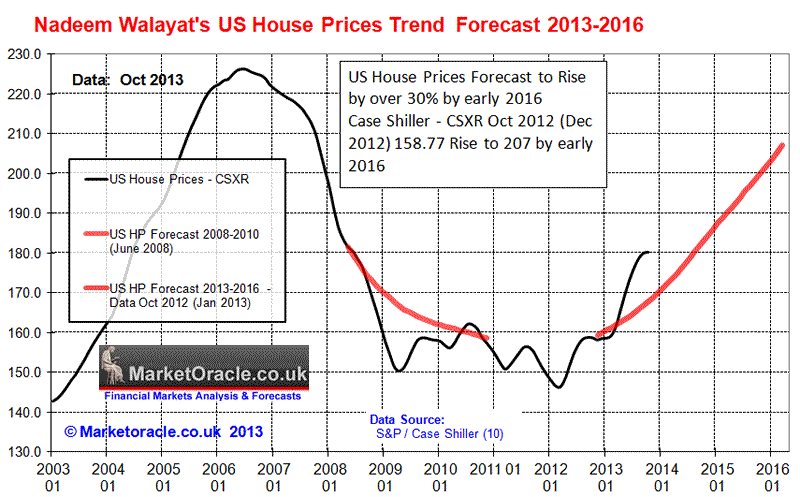
US House Prices Forecast Conclusion - As you read this, the embryonic nominal bull market of 2012 is morphing into a real terms bull market of 2013, with each subsequent year expected to result in an accelerating multi-year trend that will likely see average prices rise by over 30% by early 2016, which translates into a precise house prices forecast based on the most recent Case-Shiller House Price Index (CSXR) of 158.8 (Oct 2012 - released 26th Dec 2012) targeting a rise to 207 by early 2016 (+30.4%). As a reminder, that at the time of the publication of my forecast highly vocal commentators such as Peter Schiff where strongly bearish on the outlook for U.S. Housing market as illustrated by his video of January 2013 - "Prices have to fall, they are still much too high, and I think any body who is clinging to the hope that the real estate market has bottomed really should rethink those assumptions" "You don't want to buy anything related to real estate...., a lot of shorting opportunities there...., housing is not going to recover its going to fall for years" - Peter Schiff - Jan 2013 And as far I can see has remained consistently bearish for the duration of the U.S. housing bull market. 18th May 2015 - Peter Schiff: Monetary Death is Coming!Kitco NewsCK: You are notorious for making bold predictions. Of course, we can go back and look at those famous predictions you made leading up to that housing crisis in market crash in ’07. Is 2015 shaping up to be a disaster year or is it too soon to know at this point? PS: Well, 2015, we are not quite half over yet. My guess is that and this is not going to be the year when it hits the fan. I do believe though that when the Fed does not raise interest rates the dollar will start to decline. But since it had such a big rally it has got a long way to drop, I think, before it would get into a situation that would cause a potential currency crisis which is where I think the end game is. But we could have something like that in 2016 or 2017. But I do think the end is near as far as when this crisis is going to occur. But it is certainly possible that something happens in 2015. It is just hard to handicap it because you have got so many people that have no idea what is going on, and it is just a question of when are they going to open their eyes? When are they going to figure it out? In the housing market I was criticizing, pointing out the bubble, warning up the implication for years before the thing finally blew up. You just do not know how long it is going to take. Sometimes the bigger the bubbles are the longer they can last before people recognize them. Eventually, when they top, of course, the bigger they get the bigger the pop. My in-depth analysis and concluding trend forecast was also published in a video version during Jan 2013. U.S. Housing Market 2014 By early 2015, a year into the forecast, U.S. house prices had soared to well ahead of my forecast trend trajectory which I thus expected to slow sharply during 2014 as I expected U.S. house prices to converge towards my forecast trend trajectory during the year - 05 Jan 2014 - U.S. House Prices Forecast 2014 The latest data for October 2013 confirms my view that the U.S. housing market is going to be experiencing a severe slowdown in momentum during 2014 as the inflation rate drops from about 15% early 2014 to probably under 7% towards its end. This is in the context of my over-riding 3 year forecast of Jan 2013 to early 2016 as U.S. house prices look set to converge towards the forecast trend trajectory during 2014. By mid 2014 the sharp slowdown in price rises will prompt many commentators in the mainstream press to proclaim that the bull market has ended, when in reality it would just represent the market laying the ground work for the next leg higher during 2015 as prices oscillate around the forecast trend.
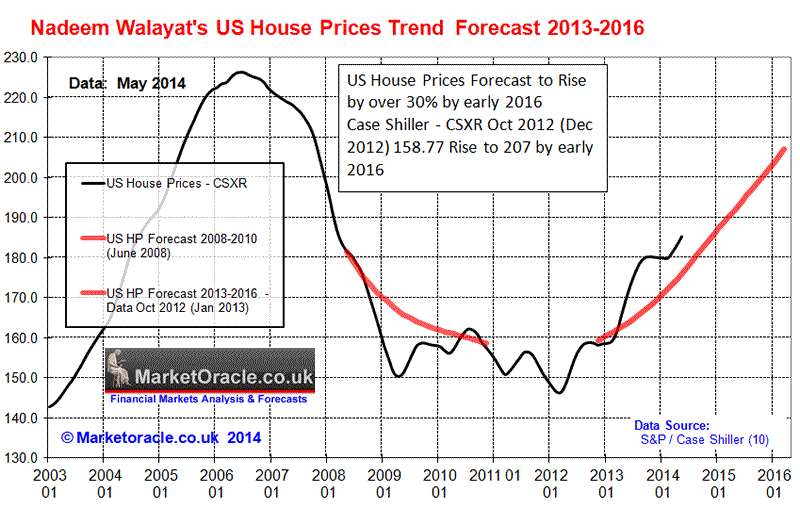
Summary for 2014 - Sharp slowdown in U.S. house prices inflation to under 7% coupled with sharp acceleration in U.S. economy to GDP 4% to 4.25%. Your analyst warning you not to pay any attention to the bubble talking fools during 2014, all of whom never saw this bull market coming and thus will continue to remain in a permanent state of denial just as they have been towards the stocks stealth bull market of the past 6 years. Understand this - we won't see a bubble peak in U.S. house prices for many more years. Mid 2014 Update By Mid 2014 the expected slowdown had begun and that I expected US house prices momentum to further weaken as prices continued to converge towards the forecast trend by the end of the year. The latest U.S. house prices data released for May 2014 (185.3) shows that U.S. house prices are gradually converging towards trend forecast as I stated they would in January 2014, with prices now standing at forecast +5.3% (May data) deviation against +7.4% in January (Oct 13 data).
U.S. House prices momentum continues to slow from a peak of +13.9% for November 2013 data to now stand at +9.2% for May 2014 data which as I warned before has mistakenly prompted many to conclude that the U.S. housing bull market could be over when all that is taking place is that U.S. house prices are oscillating around a trend of 10% per annum, and as I indicated in January 2014, that I expected U.S. house price inflation to slow to UNDER 7% before the end of this year.
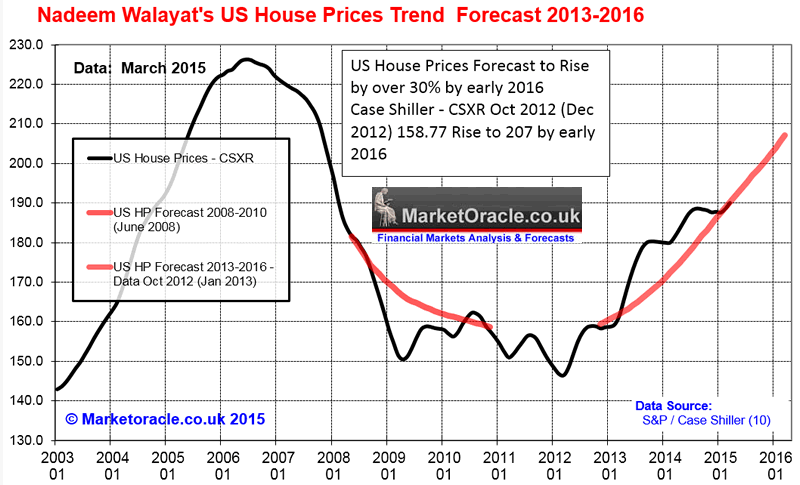
Furthermore US house price inflation looks set to continue to slow and could even slow to reach a trough of as low as 4% per annum house price inflation which whilst playing into the hands of the doom merchants, however in terms of the 3 year forecast will be of little significance. A year on the slowdown has transpired to now stand at +4.7%, and as expected has garnered much doom commentary in the mainstream press by those who missed the WHOLE bull market, which begs the question what is there break even point ? For when one puts ones money on the line then when one is wrong one LOSES money and thus have a break-even point to where prices need to fall before SHORT Open position breaks even, which illustrates the point that the most vocal lack the must fundamental driver for generating reliable probabilities for outcomes, namely that of being conditioned by actual profits and losses which in my experience is the ONLY mechanism that can condition an analyst to generate high probability forecasts. U.S. House Prices Trend Forecast Current State The latest U.S. house prices data released for March 2015 (190.04) shows that U.S. house prices have fully converged towards my trend forecast, with house prices now exactly tracking the trend forecast.
U.S. House Prices Conclusion Despite mainstream media persistent noise for an increasingly negative outlook for US house prices for a multitude of reasons, the ms-perception for which is supported by recent sharp drop in house price inflation to +4.7%, instead the continuing reality is for US house prices just oscillating around the central trend forecast of 10% per year as the long-term trend trajectory remains in tact for a rise of over 30% by early 2016. For which US house prices have about a years worth of price data to come. Therefore I see no reason to undertake a more in-depth analysis at this point in time by delving into the fundamentals of the U.S. housing market such as looking at mortgage applications, housing starts, existing and new home sales data as the price has trended towards full convergence, thus U.S. home owners can look forward to at least another 9 months of a rising trend in house prices that I am sure will be accompanied by much gloom and doom commentary that I suspect will continue all the way towards NEW ALL TIME HIGHS for average U.S. house prices which I am sure will trigger much end of the bull market double top commentary by that time.
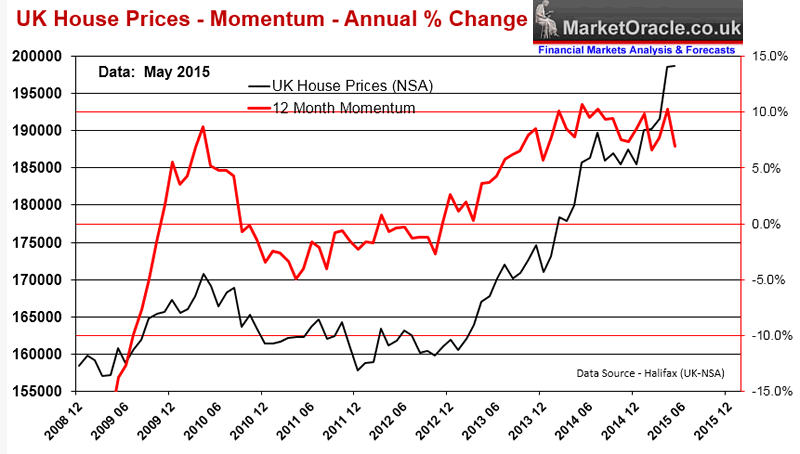
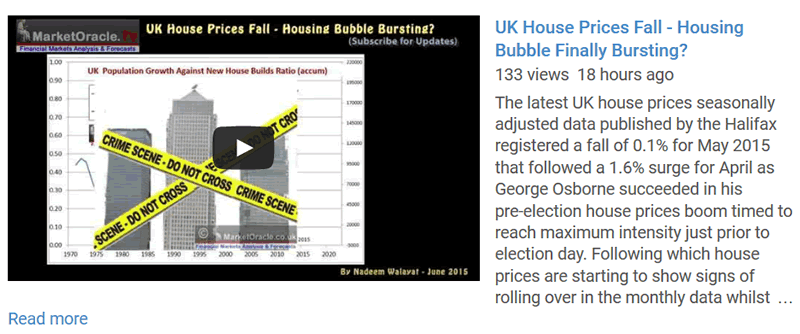
UK House Prices Post Election Fall The latest UK house prices seasonally adjusted data published by the Halifax registered a fall of 0.1% for May 2015 that followed a 1.6% surge for April as George Osborne succeeded in his pre-election house prices boom timed to reach maximum intensity just prior to election day. Following which house prices are starting to show signs of rolling over in the monthly data whilst the annual data continues to play catch up as annual inflation nudged higher to 8.6%. Which also makes a mockery of recent mainstream press deflation scare stories in the wake of annual CPI dropping to -0.1%, which at the time I warned was ignoring the elephant in the room, namely house price inflation galloping ahead at 10% per annum. House Prices Momentum The Non seasonally adjusted UK house prices momentum graph more clearly illustrates the point that the UK house prices boom was engineered to peak just prior to election day at +10.3%, which barely a month later has already taken a dive to +7%.
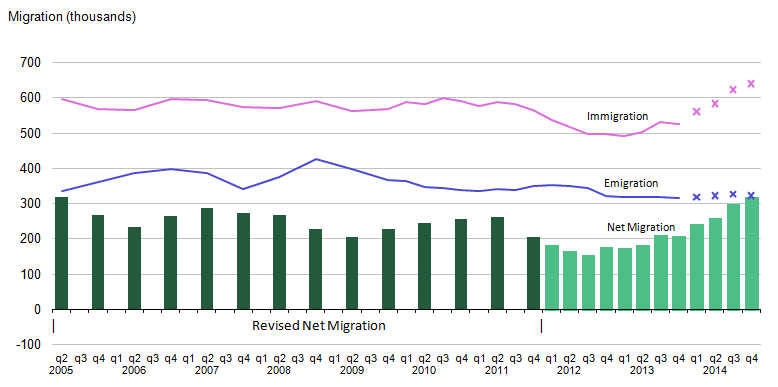
The slump in momentum is in line with my expectations for house prices momentum to fall in the months following the general election, that I expect to continue falling for a couple more months. However, don't take this post election slowdown as a harbinger of anything other than a mild correction as I expect the over-riding bull market trend to reassert as the fundamental drivers continue to strengthen Fundamental drivers such as out of control immigration with the most recent net migration figures soaring by 50% to 318k which makes a mockery of every promise and pledge that the Conservative led Coalition made for the past 5 years of not just controlling immigration which is in addition to the 250,000 natural growth (births-deaths) that remains one of the key primary mega-trend drivers for house prices.
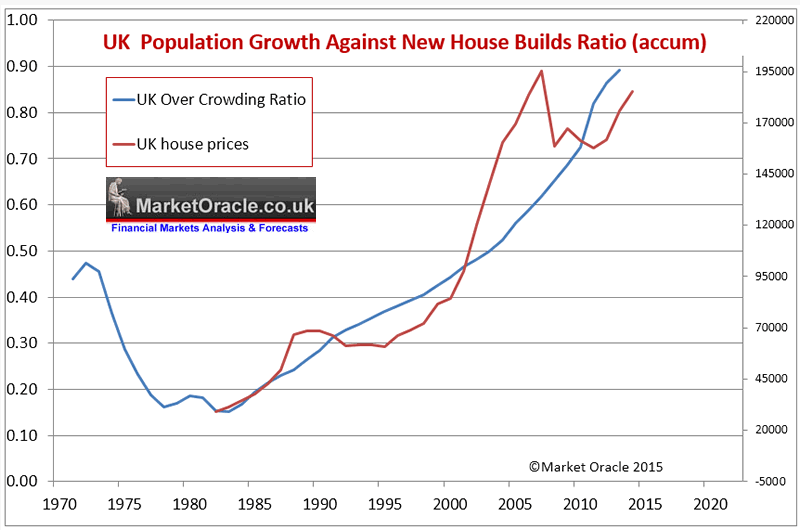
The following graph further illustrates the effect of out of control immigration on UK house prices as the ratio between the accumulative change in population since 1970 against the accumulative number of new housing builds also since 1970 as an over crowding ratio illustrates the worsening trend in the level of over crowding due to inability of new supply to meet new demand that just keeps accumulating each year which acts to propel house prices ever higher regardless of the stream of academic theories as to why house prices cannot rise because they have become increasingly un-affordable, far out pacing average wages.
Other key drivers are of course record low interest rates, yes even ordinary retail mortgage customers are temporarily reaping the rewards of an artificial banking system that is screwing savers and workers by inflating the money supply through printed money, as illustrated by the surge in mortgage approvals as there appears to be a mad dash to fix before market rates rise as the banking system encourages all to saddle up with debt financed by money conjured out of thin air (fractional reserve banking) so that everyone and everything is turned into a debt slave wholly focused on meeting those monthly interest payments rather then to rage against the machine.
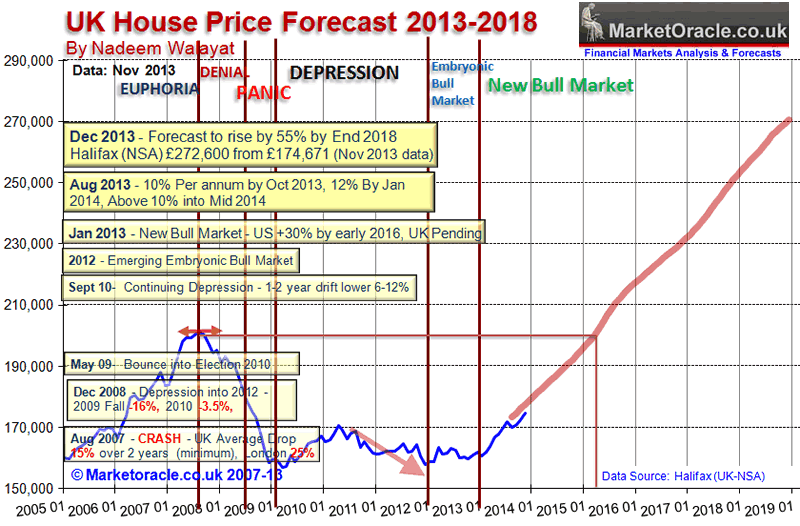
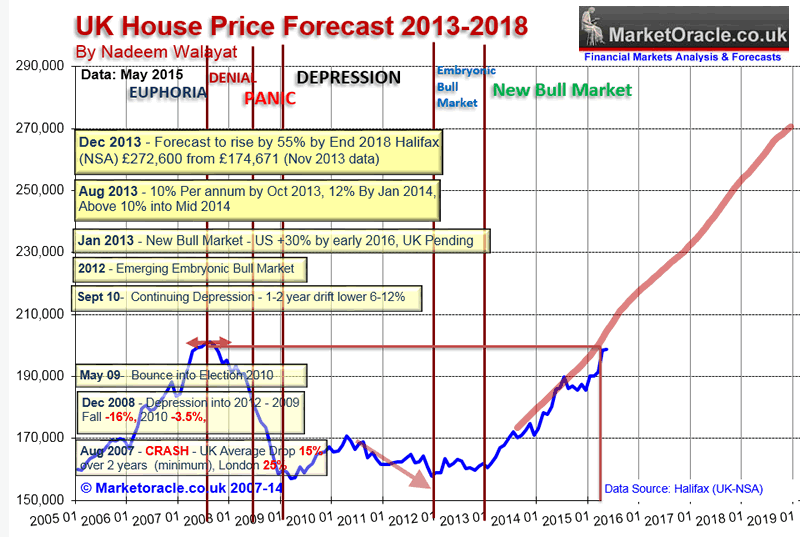
UK House Prices 5 Year Forecast It is now 15 months since excerpted analysis and the concluding 5 year trend forecast from the then forthcoming UK Housing Market ebook was published as excerpted below- UK House Prices Forecast 2014 to 2018 - Conclusion This forecast is based on the non seasonally adjusted Halifax House prices index that I have been tracking for over 25 years. The current house prices index for November 2013 is 174,671, with the starting point for the house prices forecast being my interim forecast as of July 2013 and its existing trend forecast into Mid 2014 of 187,000. Therefore this house prices forecast seeks to extend the existing forecast from Mid 2014 into the end of 2018 i.e. for 5 full years forward. My concluding UK house prices forecast is for the Halifax NSA house prices index to target a trend to an average price of £270,600 by the end of 2018 which represents a 55% price rise on the most recent Halifax house prices data £174,671, that will make the the great bear market of 2008-2009 appear as a mere blip on the charts as the following forecast trend trajectory chart illustrates:
In terms of the current state of the UK housing bull market, the Halifax average house prices (NSA) data for May 2015 of £198,684 is currently showing a 3% deviation against the forecast trend trajectory, which if it continued to persist then in terms of the long-term trend forecast for a 55% rise in average UK house prices by the end of 2018 would translate into an 10% reduction in the forecast outcome to approx a 45% rise by the end of 2018.
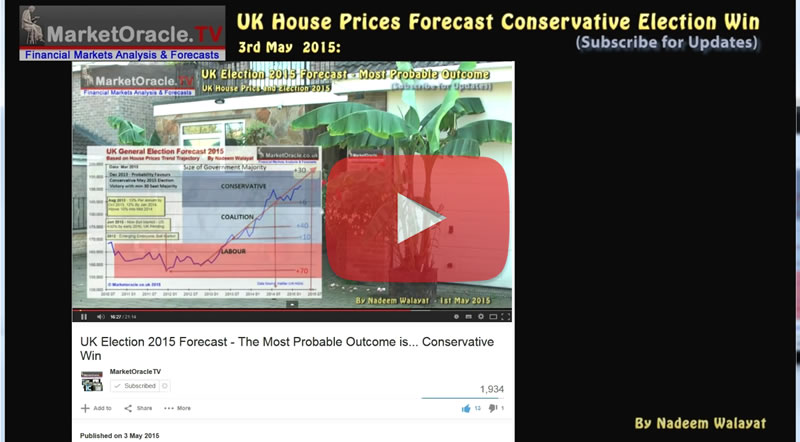
The next big milestone will be when average house prices set a new record high, which despite the post election slowdown should be imminent, and we will probably see such headlines on release of July data which also illustrates the point that George Osborne just missed achieving such headlines just prior to election day. UK House Prices into the 2020's Looking beyond my existing five year forecast covering the period 2014-2018, that after 7 years of relative economic pain (2008-2014) as illustrated by the cost of living crisis, Britain this year has entered a 7 year economic boom (above trend growth) that can only continue to drive the UK house prices bull market to well into the 2020's, for which I at least expect an average price increase of 10% per annum, that's a minimum 70% further rise in average house prices! Details on this to come over many more years so ensure you are subscribed to my always free newsletter to get in-depth analysis and detailed trend forecasts in your email in box. UK House Prices Forecast Conservative Election Win Whilst the opinion pollsters, academics, pseudo-analysts (journalists) and book makers ALL got the 2015 UK general election result badly wrong right upto the close of the polls, who collectively forecast that the only workable outcome would be one of a minority Labour government supported by the SNP. Instead the actual result surprised all by delivering an outright majority Conservative government that not even the BBC exit poll forecast and which only became apparent after about 600 of the 650 results were declared. However, for what actually did prove virtually spot on in forecasting the outcome of the UK general election 2015, I turn to my analysis of UK house prices that since December 2013 consistently forecast a Conservative outright election victory as illustrated by the following video summary - Furthermore, since I have a good idea of how house prices will perform over the next 5 years I can tell you with some confidence that the Conservatives are also likely to win the 2020 general election! Though, in the interests of accuracy do come back to my detailed analysis to conclude in seats per party forecasts that I will probably publish a year or so before the next general election. Ensure you are subscribed to my always free newsletter to get housing market in-depth analysis and detailed trend forecasts in your email in box. Also visit the MarketOracleTV youtube channel for video versions of my analysis and concluding trend forecasts. Source and Comments: http://www.marketoracle.co.uk/Article50966.html By Nadeem Walayat Copyright © 2005-2015 Marketoracle.co.uk (Market Oracle Ltd). All rights reserved. Nadeem Walayat has over 25 years experience of trading derivatives, portfolio management and analysing the financial markets, including one of few who both anticipated and Beat the 1987 Crash. Nadeem's forward looking analysis focuses on UK inflation, economy, interest rates and housing market. He is the author of five ebook's in the The Inflation Mega-Trend and Stocks Stealth Bull Market series that can be downloaded for Free.
You're receiving this Email because you've registered with our website. How to Subscribe Click here to register and get our FREE Newsletter To access the Newsletter archive this link Forward a Message to Someone [FORWARD] To update your preferences [PREFERENCES] How to Unsubscribe - [UNSUBSCRIBE]
The Market Oracle is a FREE Financial Markets Forecasting & Analysis Newsletter and online publication. |
||||||||||||||||
© 2005-2022 http://www.MarketOracle.co.uk - The Market Oracle is a FREE Daily Financial Markets Analysis & Forecasting online publication.


