


Gold Price and HUI Stocks Short Term Bottom?
Commodities / Gold and Silver Stocks 2015 Sep 14, 2015 - 10:04 AM GMTBy: Dan_Norcini

 Maybe - based on today's price action in both the metal and in the mining shares (HUI) but only short term.
The shares were actually a bit more convincing than the actual metal, which is something one would like to see anyway if they are looking to be bullish.
The HUI opened lower, promptly fell apart but then began gradually climbing back up off the worst levels of the session as the day wore on. By the time of the close, they had managed to eke out a small gain.
HUI Daily Chart
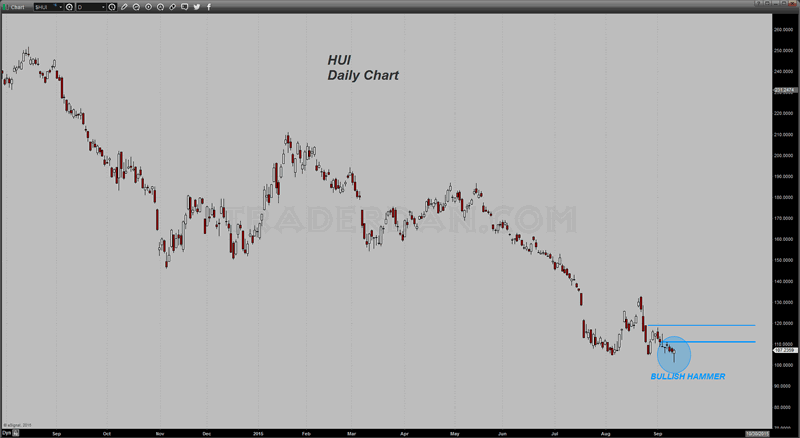
The pattern formed on the daily price chart is a bullish hammer pattern, named for a market which, after being in a long, sustained downtrend, "hammers" out a bottom.
As weak and as lousy as this sector has been, I would definitely want confirmation which will either come next week or not. I have drawn in two successive resistance levels which in my view, will need to be bettered for that hammer pattern to be validated.
The first one is near the 110 level; the latter is just beneath 120.
HUI Monthly Chart
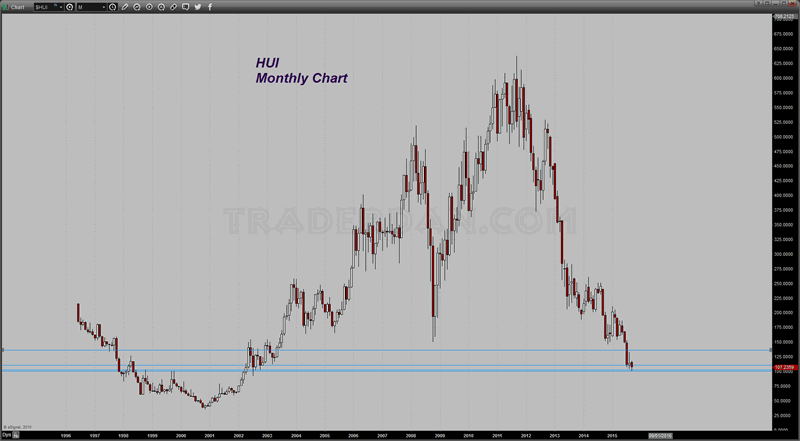
Keep in mind that we are talking about an index that managed to hold at a THIRTEEN YEAR LOW, so that is not exactly something worth throwing a parade over.
As for me personally, if I want any sort of paper gold, it is not going to be mining shares as I would not touch them with a ten foot pole seeing that most of them are run by people who know next to nothing about risk management or hedging. Why bother with them when you get a pure gold play by merely buying the gold ETF, GLD and dispensing with all of the headaches associated with miners such as huge debt loads, depleting mines, labor problems, lawsuits, incompetent management, etc. If you want a dividend paying stock, buy something in the oil sector!
But for an index that has collapsed from near 160 at the beginning of the year, to its low of today just above 100, [ A loss of some 37.5% alone this year - UGH], I guess those who insist on owning these dogs are entitled to a respite of some sort. That hammer formation generally tells us that the selling has been exhausted for the time being. We'll see next week.
There is nothing on the chart as far as the technical indicators go that would generate a buy signal as of yet.
HUI Daily Charts 2 and 3
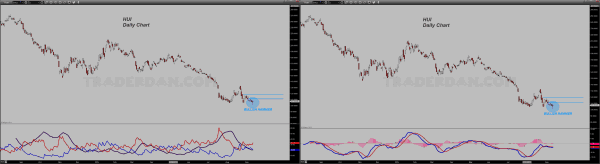
The MACD at the lower chart could perhaps be construed as reflecting some positive or bullish divergence as it is picking up the loss of downside momentum, but it has yet to yield a buy signal. Maybe next week it might if there is much in the way of upside follow through.
I really am not sure what the reason was for the rebound in gold off its lows today other than the thinking that the Fed would stay on hold next week on the interest rate hike front. My thinking about that is that even if they do stand pat, while gold might get a bit of a relief bounce off of that seeing that it will probably serve to undercut the dollar strength somewhat, traders are going to be looking for a rate hike at the next month's meeting or the one after that, etc. In other words, gold is living on borrowed time as far as the market is concerned since it is a matter of "when" and not "if" the Fed is going to finally hike.
The "IF" might not come until next year for all we know but one thing to consider about to this, is if the economy remains so weak that the Fed cannot hike, then what does that say about commodity prices in general? Answer - they will tend to move lower on slow growth concerns. How that can be considered bullish for gold is beyond my comprehension since we are dealing with the deflationary symptoms which thus far have cut the legs out completely from beneath the metal.
I suspect today was more a case of the break into the sub $1100 region being a reason for some of the recent shorts to go ahead and book some gains more than anything else.
With crude oil giving up its gains from yesterday, and with more selling pressure being seen in silver and platinum, along with the bonds moving higher, there was probably a bit more of that same safe haven type buying in gold which has helped to offset some of the selling pressure tied to the "sell commodities" macro trade. Also, as the US Dollar weakened during the session and the Euro moved above 1.130, some shorts used that as a reason to lift some positions.
In looking over this week's COT data and graphing it out, we can see that while the hedge funds still remain as net longs in the gold futures market, they did cut that position somewhat (about 16,000); mainly by the addition of fresh short sales and the liquidation of relatively few longs by comparison.
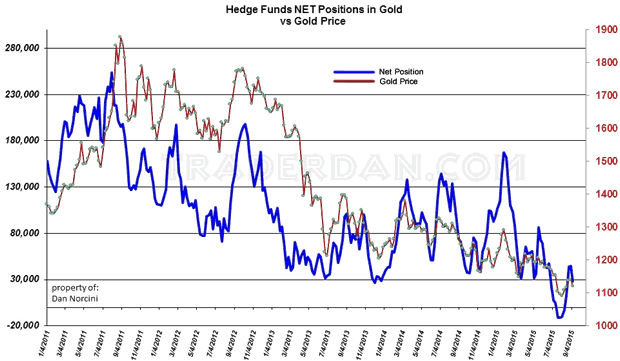
Here is the usual chart of the total speculative positions compared to the price of gold itself.
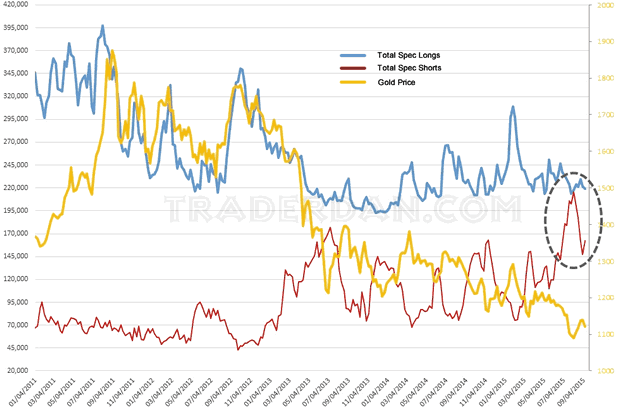
One thing that really stands out for me when I look at these two charts is how the number of outstanding speculative shorts has shrunken so considerably from its peak (the same goes with the net long position of the hedge funds although in the inverse) while gold [ as of Tuesday ] is a mere $50 off of its July low near $1170.
The latter chart tells me that if these speculators get really serious about selling gold short based on a decided consensus that the Fed will move on interest rates which will support the Dollar, they have an awful lot of room in which to come in and pound this metal lower.
The current number of cumulative spec shorts is over 53,000 short positions below its recent peak. That leaves a lot of room if bearish sentiment begins to grow once again.
I have no way of knowing in advance whether or not that might be the case but as a trader, I have to look at possibilities and be prepared. My personal view of this market at this time is that traders want to sell rallies in the metal and are thus looking for resistance levels at which any price movement higher fails. That is what they did in the previous week when gold failed to extend at $1150 and again when it failed at $1125.
For those more interested in the short term moves, try using an hourly or two hourly chart to catch some signals.
here is the 2 hour:
Gold 2-Hour Chart
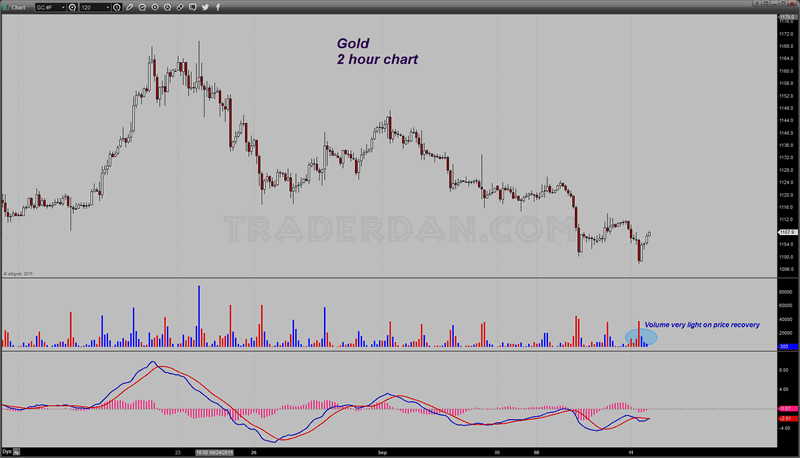
Notice how light the volume is on the upside recovery in price. I interpret this as mainly some pre-weekend short covering and nothing more. Stronger volume would have made the potential for more than a short term bottom much more convincing.
We'll see what we get early next week.
Dan Norcini
Dan Norcini is a professional off-the-floor commodities trader bringing more than 25 years experience in the markets to provide a trader's insight and commentary on the day's price action. His editorial contributions and supporting technical analysis charts cover a broad range of tradable entities including the precious metals and foreign exchange markets as well as the broader commodity world including the grain and livestock markets. He is a frequent contributor to both Reuters and Dow Jones as a market analyst for the livestock sector and can be on occasion be found as a source in the Wall Street Journal's commodities section. Trader Dan has also been a regular contributor in the past at Jim Sinclair's JS Mineset and King News World as well as may other Precious Metals oriented websites.
Copyright © 2015 Dan Norcini - All Rights Reserved
All ideas, opinions, and/or forecasts, expressed or implied herein, are for informational purposes only and should not be construed as a recommendation to invest, trade, and/or speculate in the markets. Any investments, trades, and/or speculations made in light of the ideas, opinions, and/or forecasts, expressed or implied herein, are committed at your own risk, financial or otherwise. The information on this site has been prepared without regard to any particular investor’s investment objectives, financial situation, and needs. Accordingly, investors should not act on any information on this site without obtaining specific advice from their financial advisor. Past performance is no guarantee of future results.
Dan Norcini Archive |
© 2005-2022 http://www.MarketOracle.co.uk - The Market Oracle is a FREE Daily Financial Markets Analysis & Forecasting online publication.