


Coffee Commodity Price Downtrend Continues
Commodities / Coffee Sep 13, 2015 - 01:49 PM GMTBy: Austin_Galt

 The coffee price is now down in an area with potential for a low to be put in. However, until there are signs of price turning back up more downside has to be favoured.
Let's revise the weekly and monthly charts.
Coffee Weekly Chart
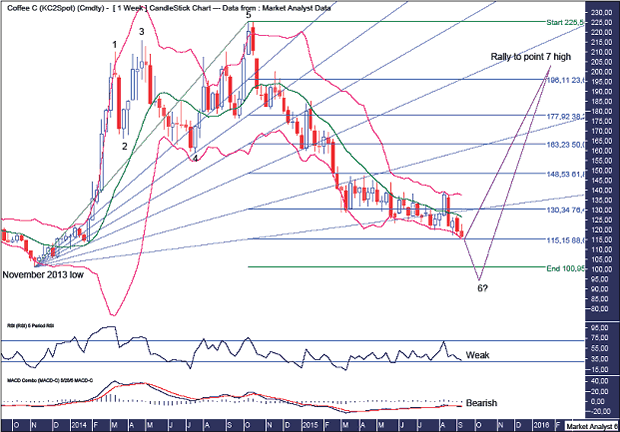
There is currently a 5 point broadening top in place while I continue to believe this will eventually morph into a 7 point broadening top. So the search for a point 6 low continues.
Previously, I thought this point 6 low would come in above the November 2013 low at $100.95. However, given the current price action, I now have my doubts. Why?
I have drawn a Fibonacci Fan from the November 2013 low and I was looking for the 88.6% level to provide support and see in the point 6 low. Some support was shown at this angle however price could just not go on with the job and is now breaking down below this angle. This leads me to believe price is probably headed below $100.95 to put in the point 6 low.
I have added Fibonacci retracement levels of the move up from November 2013 low and price is now down at the 88.6% level which stands at $115.15. This is the last stand and with price now at $116 it is now or never. I favour "never". Then again, never say never!
The Bollinger Bands show price recently trading up to the upper band but it could not follow through and is now back at the lower band. I suspect the downtrend may even gain momentum here as it clings to the lower band.
The RSI remains in a weak position while the MACD indicator has just made a bearish crossover.
A move to new yearly lows now brings into contention another common pattern found throughout financial markets. Let's go to the monthly chart to see what it is.
Coffee Monthly Chart
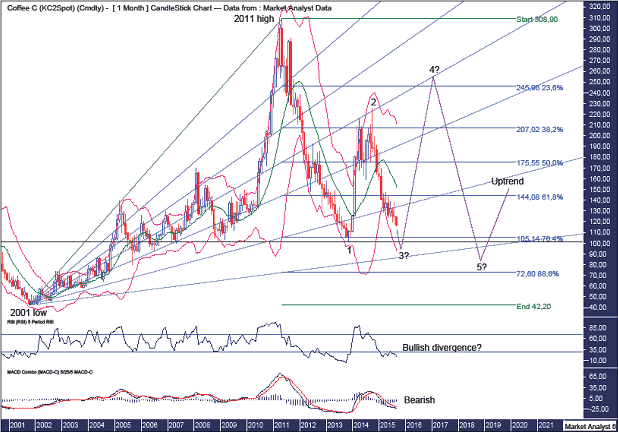
A move to new yearly lows would see the potential for a 5 point broadening low with the new low now being point 3. Then a big move up to a point 4 high which would see price trade above the point 2 high of $225.50. Then the final move to set up a point 5 low.
I have drawn a Fibonacci Fan which shows the point 2 high was right at resistance from the 50% angle. Perhaps the point 4 high will be at resistance once again there. In the meantime, perhaps the point 3 low sets up just above the 88.6% angle while the point 5 low is just below.
Price turning up now without making a new yearly low would mean an ABC correction is in play with the current low point B with a big wave C ahead. This was my original thinking and remains a valid outcome.
I have added Fibonacci retracement levels of the move up from 2001 low to 2011 high. The long term view, outlined in January 2015, is that the final low will be around support from the 88.6% level which stands at $72.60. Just how price gets there remains in question.
The Bollinger Bands show price has left the lower band but without any impulsive upside action it looks as if price is about to have another lash at that lower band.
A new low now would likely set up a bullish divergence on the RSI and then perhaps in the future a point 5 low would set up a triple bullish divergence. Time will tell.
The MACD indicator is currently bearish while a new low now would also set up a bullish divergence.
Summing up, the downtrend continues unabated and, while a big rally is expected shortly, until there is a sign of a turnaround then further downside has to be favoured in the near term.
By Austin Galt
Austin Galt is The Voodoo Analyst. I have studied charts for over 20 years and am currently a private trader. Several years ago I worked as a licensed advisor with a well known Australian stock broker. While there was an abundance of fundamental analysts, there seemed to be a dearth of technical analysts. My aim here is to provide my view of technical analysis that is both intriguing and misunderstood by many. I like to refer to it as the black magic of stock market analysis.
Email - info@thevoodooanalyst.com
© 2015 Copyright The Voodoo Analyst - All Rights Reserved
Disclaimer: The above is a matter of opinion provided for general information purposes only and is not intended as investment advice. Information and analysis above are derived from sources and utilising methods believed to be reliable, but we cannot accept responsibility for any losses you may incur as a result of this analysis. Individuals should consult with their personal financial advisors.
Austin Galt Archive |
© 2005-2022 http://www.MarketOracle.co.uk - The Market Oracle is a FREE Daily Financial Markets Analysis & Forecasting online publication.