


Dow Jones Stock Market Index Threatening to Break Critical Support Level
Stock-Markets / Stocks Bear Market Jun 26, 2008 - 07:54 AM GMTBy: Kurt_Kasun

 Is the Party Over?
For this week, access to much of Elliott Wave International's forecasts and chart work is free. Many traders and investors boldly proclaim that technical analysis, such as that provided by Elliott Wave and others, is akin to voodoo and advise investors to stick to the fundamentals. To which I reply: ignore technical indicators at your peril. Such avoidance/arrogance (you think you are so much smarter than the market) is particularly damaging to portfolios in two instances. One, when they involve macro themes which the names in your portfolio will be unable to escape. Two, when the change in trend only occurs after a long period of time: The longer the period before trend reversal or violation, the more powerful the potential effect on your investment.
The following chart is from Elliott Wave International:
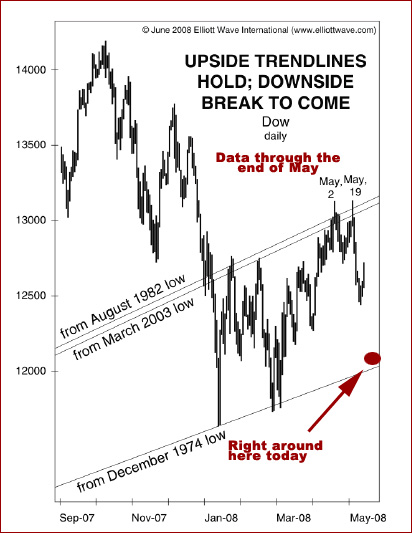
We see that we have demonstrably violated the trend lines for the bull markets for the Dow Jones Industrial Average dating back to 1982 and 2003. It appears likely that we are going to test the trend line for the market dating back to 1974 for the third time this year. The market was unable to sustain a move above the 1982 and 2003 bull market trend lines during the market rebound following the Fed bailout of Bear Stearns on St. Patrick's Day.
A violation of the 1974 supporting trend line could spell doom and start a mean reversion which would bring the average below 5000 as the chart provided by sharelynx.com indicates:
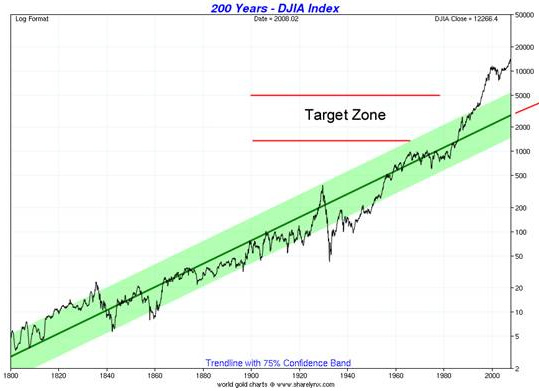
You can easily make the argument that the DJIA remains extended versus its 200-year trend line and is therefore still very vulnerable to a big correction. Few stocks would be spared in such a downdraft. Do you have a slightly greater appreciation for technical indicators? 200 years is a long time. If we are taught that movements always revert to the mean, then we are almost assured that a correction is inevitable. But when? It could be this week. I am surprised in the low reading of the CBOE volatility index (VIX) as we look to dive deeper and test the March lows in the S&P 500 and Dow Jones averages. Either traders are very confident that the March lows (and the supporting 1974 trend line) will hold or they are obliviously complacent and poised to endure much pain if it does not. The Nasdaq is holding up relatively well which is bullish as it tends to lead. The financial stocks have taken out their March lows and they also tend to lead the market. This is bearish. Perhaps market participants are betting this is the final washout for the financials and the market will soon move higher as all of the bad news is priced in. This song risks becoming a broken record.
The lows may in fact hold. I am very concerned, however, with the general contentment the market is displaying as it absorbs the selloff and we approach the edge of the cliff (again). Regarding the title of this week's commentary, the party has been over for quite some time for tech, real estate, financials, and retail, yet many commentators continue to recommend them. A couple of weeks ago I was helping a friend pick mutual funds for his 401(k) plan. Of the 20 or so funds available, amazingly, none of them placed materials, energy, or commodities as the top group by sector representation—some had energy in third, but always after tech and financials—this after several years of under-performance. It just goes to show you that the vast majority of the world is composed of sheep and people are slow to adjust to long lasting trends.
But what about the stuff that has been working that you had the forethought and wisdom to have beneficially invested in? The focus of this commentary, is on the groups of stocks that have benefited since 2002—base metals, energy (oil, coal, natural gas), agriculture, precious metals, and infrastructure. What will happen to them as the broader market indexes swoon? And what about emerging markets? While some emerging markets continue buck the trend of a developed world slowdown, showing signs of economic resilience, there appears to be less evidence of the ‘decoupling' of their financial markets.
I think the outcome depends on whether the US Government is successful (either unwittingly or through cleverly deceptive foresight) in fighting the deflationary effects of the deleveraging of financial companies and consumers and the deflationary effects of having to service the tremendous debt overhang we have amassed over the last few decades. I remain in “camp inflation” and believe that we will hit the accelerator on the money printing machine (as will other countries around the world) and will monetize our debt and devalue our currency (more against tangible assets than other currencies). This will result in higher prices against lower wages and a standard of living adjustment we have not experienced since the Great Depression. But it might allow us to avoid a total collapse of society as holders locked into to (what will be) relatively low interest rates might be able to afford to make their mortgage payments which would be much cheaper in tomorrow's dollar terms. Keeping people in their homes might be the best we can hope for.
The risk to this view is that the Government would prefer to actually preserve the value of the dollar and willfully select a deflationary outcome, or that they would fail to properly execute an inflationary scheme. To the extent our Congress is involved, you can bet they would not fail to execute in creating inflation.
If you wanted to prepare your portfolio for either scenario, an easy strategy would be to go long a precious metal ETF and short the DJIA. Look at the chart below provided again by sharelynx.com:
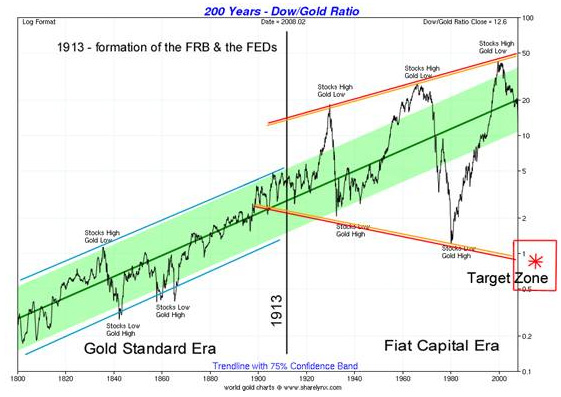
You can see in the chart above that the world fiat currency regime is becoming increasingly wobbly and appears to be reaching the limits of sustainability. The emerging megaphone chart pattern portends gloom for the DJIA and boom for gold as the ratio descends from almost 50:1 to 1:1. The Long/Short strategy would work best in deflationary environment and would also work for you in an inflationary world as gains the price of gold would far exceed gains in the DJIA. However, if you still hold to inflationary view, as I do, you want to be flat out long gold and not short a market that might not be rising in real terms, but would in nominal terms.
This is why it is important that the 1974 trend line hold as support. A sustained drop below it would force me to consider that we are in store for deflation and that the Fed is either unwilling or unable to prevent the deflationary outcome. We would also need to consider exiting most other commodity-related investments (with the exception of precious metals) which have worked so well for us since 2002. Commodity bulls continue to make the case that we have at least another decade for the bull market to play out. While I respect this historically correct view, I continue to believe that the "decennial pattern" is more likely and a spectacular leg to the rally into early part of next decade will result into a "blow-off top." Either scenario for commodity bulls is wrong if we are on the brink of a deflationary collapse.
It is therefore crucial to monitor market activity and to see if the major support levels are breached. I expect this current episode to be another deflationary panic event and that the DJIA will hold and continue to be range-bound between the 1974 bull market trend lines and the 2002/1982 bull market trend lines for another year or so. 2009 will likely be the year to increasingly transition into precious metals and out of your other commodity holdings.
*My new retail newsletter service, the Global MegaTrends Portfolio , is now available to subscribers. Please click to learn more!
By Kurt Kasun
A contributing writer to GreenFaucet.com , Kurt Kasun writes a high-end investment timing service, GlobalMacro, which is focused on identifying opportunities that produce returns in excess of market with reasonable risk. He is strategically located in Washington , D.C. , a key to maintaining contacts and relationships which help Kurt understand global policy and economic factors as they emerge. His investment approach has always been macro in nature largely due to his undergraduate studies at the U.S. Military Academy at West Point (B. S. National Security, Public Affairs, 1989) and his graduate studies at George Mason University (M.A. International Commerce and Policy, 2006).
Disclaimer: The above is a matter of opinion provided for general information purposes only and is not intended as investment advice. Information and analysis above are derived from sources and utilising methods believed to be reliable, but we cannot accept responsibility for any trading losses you may incur as a result of this analysis. Individuals should consult with their personal financial advisors before engaging in any trading activities.
Kurt Kasun Archive |
© 2005-2022 http://www.MarketOracle.co.uk - The Market Oracle is a FREE Daily Financial Markets Analysis & Forecasting online publication.