


Stock Market Primary IV Wave Continues
Stock-Markets / Stock Markets 2015 Sep 06, 2015 - 02:49 PM GMTBy: Tony_Caldaro

 Another volatile week! The week started off with two consecutive gap down openings after starting at SPX 1989. By late Tuesday the SPX was down to 1903. Wednesday and Thursday it reversed with two gap up openings, carrying the SPX to 1975 by Thursday morning. On Friday the market gapped down at the open taking the SPX to 1911. For the week the SPX/DOW were -3.35%, the NDX/NAZ were -3.15%, and the DJ World index was -3.60%. On the economic front positive/negative reports came in even. On the uptick: construction spending, factory orders, the ADP, the GDPN, plus the unemployment rate and trade deficit improved. On the downtick: the Chicago PMI, both ISM’s, the WLEI, payrolls, plus weekly jobless claims rose. Next week will be highlighted by the PPI, Export/Import prices and Consumer sentiment. Best to your week!
OVERVIEW
Last weekend we posted several points that we feel are worth repeating. Last Monday’s flash crash at the open and retest on Tuesday was an international event. Many of the emerging markets, and commodity driven foreign indices, which had been rising in corrective patterns for the past number of years, appear to have completed those patterns and are now back in bear markets. Our list includes: Australia, Canada, Hong Kong, Indonesia, Singapore and S. Korea. These indices join Brazil, Greece and Russia, which had already been in bear markets. These nine indices represent half of the foreign indices we track. Obviously the rest of the indices, plus the US, are now facing some headwinds.
The selloff, after breaking SPX 2040 support, was so rapid that it nearly triggered a long term downtrend. Long term downtrends are confirmed only during bear markets. They never, ever occur during bull markets. This was quite unexpected, and suggests additional caution should be maintained until this bull market reasserts itself. Should the market break last Monday’s/Tuesday’s SPX 1867 low, any time in the future, a long term downtrend could to be triggered, and we too will be in a bear market. Naturally we will post this information in the daily update when/if it occurs.
LONG TERM: bull market
We continue to label this six year bull market as Cycle wave [1] of the new Super cycle 3 bull market. Cycle wave bull markets rise in five primary waves. Primary waves I and II completed in 2011, Primary wave III completed in May of this year, and Primary wave IV appears to be still underway. When Primary IV completes, which we now estimate will be between the 1828, 1841 and 1869 pivots, Primary V will begin.
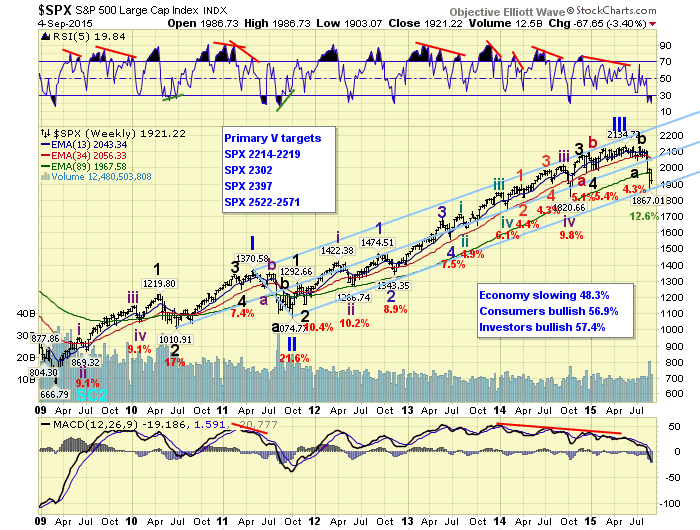
Fifth waves however, during this bull market and others, have been notoriously weak. A simple glance at the Major wave 5’s during Primary waves I and III illustrate this quite well. Nothing more than marginal new highs before those primary waves ended. If Primary wave IV ends at SPX 1867 we have made some projections for Primary wave V. There is a price cluster between SPX 2214 and SPX 2219, if higher SPX 2302 or SPX 2397, then another cluster between SPX 2522 and SPX 2571. The two clusters suggests the minimum and the maximum upside targets for the rest of the bull market.
MEDIUM TERM: downtrend
Primary wave II was a complex elongated flat. This pattern, while unusual, was exactly the same pattern that occurred during the 1987 crash and bear market. Since Primary waves should alternate in pattern we are not expecting an elongated flat for Primary IV. We are expecting a zigzag to alternate with that flat. The zigzag could start off looking quite similar to Primary II, since the first part of that correction was a zigzag. And it does!
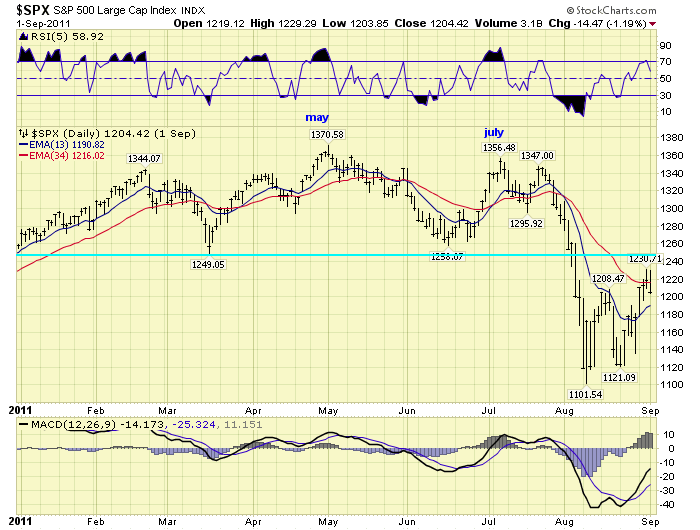
When comparing the two Primary wave corrections we see lots of similarities. Primary I and III both topped during an extended period of low volatility. During 2011 the SPX had traded in a 121 point range for seven months, and during 2015 a 95 point range for six months. During this low volatility period Primary waves I and III both topped in May of their respective years. Then there was a downtrend low to start Primary waves II and IV, followed by a lower uptrend high into July, when the NDX topped. After that the SPX entered another downtrend. Then when the SPX broke six month support, SPX 1249 in 2011 and SPX 2040 in 2015, there was a quick and steep selloff lasting several days in August.
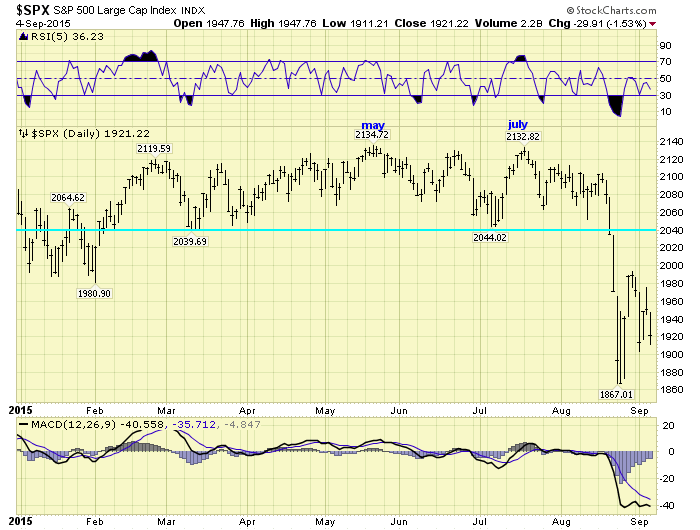
During Primary II the SPX went into a volatile trading range during September, then bottomed in October. Our current market is now in a somewhat similar volatile trading range, but we are expecting it to bottom this month.
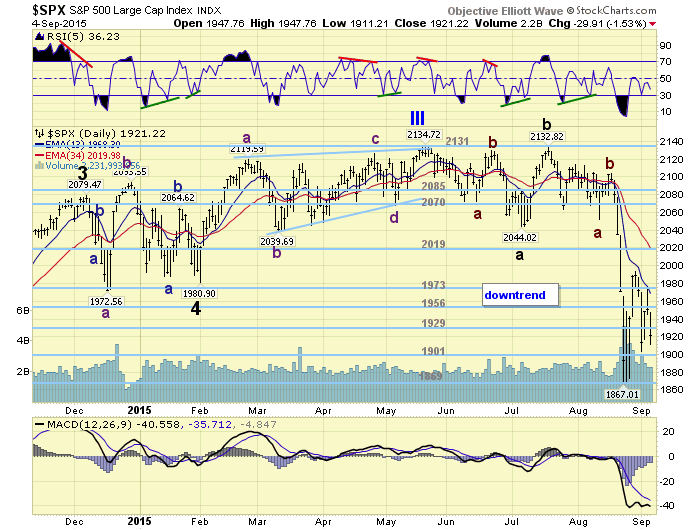
We have labeled the SPX 2135 May high as Primary III. Then the July SPX 2044 low and July SPX 2133 high as Major waves A and B. The Major wave C downtrend has been underway since that high. Major wave A was labeled with three Intermediate waves: 2072-2129-2044. Major wave C is also being labeled with three Int. waves: 2052-2103-underway. Medium term support is at the 1901 and 1869 pivots, with resistance at the 1929 and 1956 pivots.
SHORT TERM
Due to the recent activity, and the expectations of Primary IV ending within a week or so, we have shifted the Intermediate wave C of Major C count. We are now labeling the double bottom low at SPX 1867 as Minor A, and the rally to SPX 1993 as Minor B. Minor C, to retest the 1869 pivot, or decline to one of the two lower pivots, should be underway.
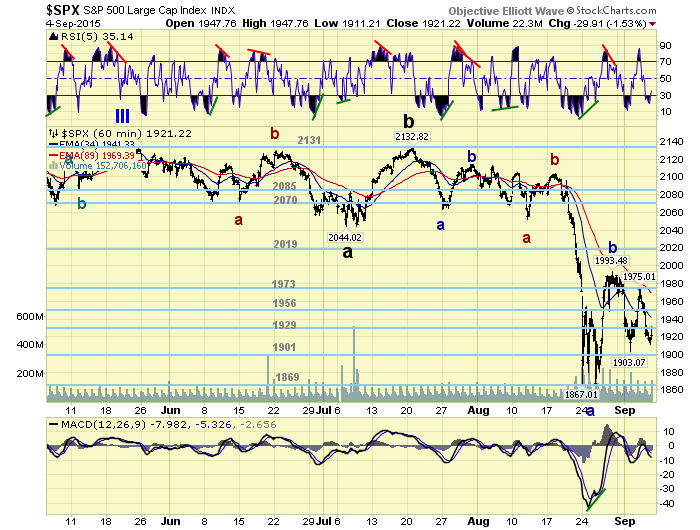
Short term support is at the 1901 and 1869 pivots, with resistance at the 1956 and 1973 pivots. Short term momentum ended the week just above oversold. Best to your Tuesday trading!
FOREIGN MARKETS
Asian markets were all lower on the week for a net loss of 3.4%.
European markets were mostly lower for a net loss of 3.0%.
The Commodity equity group were all lower losing 3.0%.
The DJ World index is still in a downtrend and lost 3.6%.
COMMODITIES
Bonds continue to uptrend and gained 0.4% on the week.
Crude is trying to confirm an uptrend and gained 1.6% on the week.
Gold is also trying to confirm an uptrend but lost 1.0% on the week.
The USD is still in a downtrend but gained 0.2% on the week.
NEXT WEEK
Monday: holiday. Tuesday: Consumer credit at 3pm. Thursday: weekly Jobless claims, Export/Import prices, and Wholesale inventories. Friday: the PPI, Consumer sentiment and the Budget deficit. Best to your three day weekend!
CHARTS: http://stockcharts.com/public/1269446/tenpp
After about 40 years of investing in the markets one learns that the markets are constantly changing, not only in price, but in what drives the markets. In the 1960s, the Nifty Fifty were the leaders of the stock market. In the 1970s, stock selection using Technical Analysis was important, as the market stayed with a trading range for the entire decade. In the 1980s, the market finally broke out of it doldrums, as the DOW broke through 1100 in 1982, and launched the greatest bull market on record.
Sharing is an important aspect of a life. Over 100 people have joined our group, from all walks of life, covering twenty three countries across the globe. It's been the most fun I have ever had in the market. Sharing uncommon knowledge, with investors. In hope of aiding them in finding their financial independence.
Copyright © 2015 Tony Caldaro - All Rights Reserved Disclaimer: The above is a matter of opinion provided for general information purposes only and is not intended as investment advice. Information and analysis above are derived from sources and utilising methods believed to be reliable, but we cannot accept responsibility for any losses you may incur as a result of this analysis. Individuals should consult with their personal financial advisors.
Tony Caldaro Archive |
© 2005-2022 http://www.MarketOracle.co.uk - The Market Oracle is a FREE Daily Financial Markets Analysis & Forecasting online publication.