This Stock Market VIX Chart Should Blow Your Mind
Stock-Markets / Stock Markets 2015 Sep 03, 2015 - 06:48 PM GMTBy: EWI
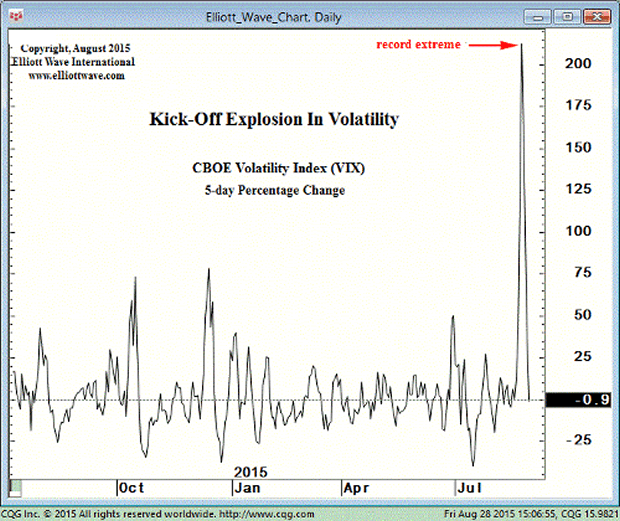
 Price volatility in stocks and other instruments has been stunning the past few weeks. The VIX chart from the August 28 Elliott Wave Short Term Update puts the massive moves in perspective:

Short Term Update editor Steve Hochberg writes:
"This chart of the 5-day percentage change in the CBOE Volatility Index (VIX) shows [you] the explosiveness of Monday's [Aug. 24] range, as the percentage change shot to a record extreme for the index's 25-year history...
"In a section titled 'Here Comes the Volatility,' the July issue of [our] Elliott Wave Financial Forecast (see p. 7) said that an 'era of low volatility will be replaced by head-spinning stock market moves that will shake global stock markets to their foundation."
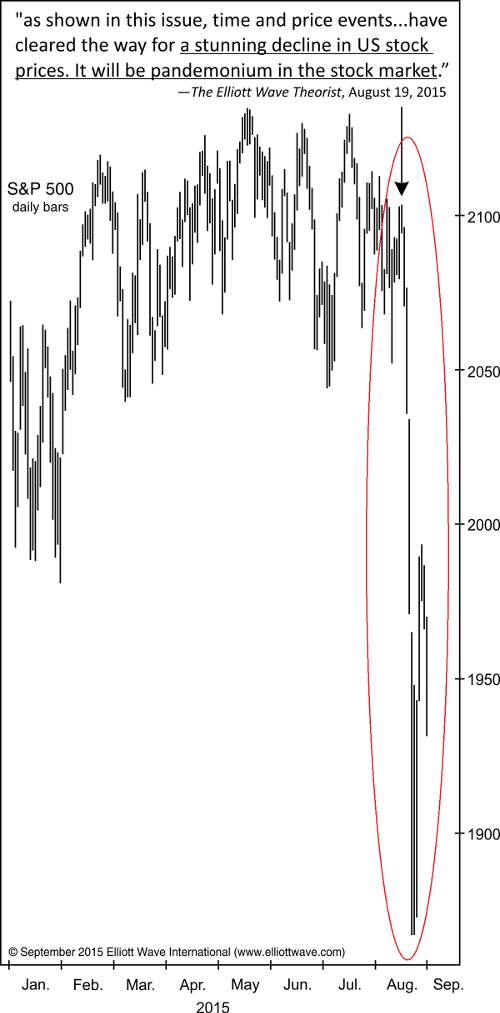
This stunning spike in volatility came on the heels of the forecast Bob Prechter, Elliott Wave International's president, made in his new Elliott Wave Theorist on August 19, one day before the bottom fell out:
"As shown in this issue, time and price factors call for an immediate end to this dream state. It will be pandemonium in the stock market.
"Time and price events have cleared the way for a stunning decline in US stock prices."
You can see what happened next:

Read more in your free report: Pandemonium in the Stock Market99.9% of investors are panicking right now; Elliott Wave International's subscribers are not. Why? Because they were prepared. EWI prepared them for the 2007-2009 crisis, and they're doing it again. In fact, in the calm of Aug. 18, EWI's own Bob Prechter wrote a sharp critique of the U.S. stock market in his new Elliott Wave Theorist, in which he said to expect market "pandemonium." (His commentary was published the following day.) "as shown in this issue, time and price factors call for an immediate end to this dream state. When the alarm goes off and the dreamers awake, it will be pandemonium in the stock market. As the next few charts show, time and price have run out of room. Together, these time and price events seem finally to have cleared the way for a stunning decline in US stock prices." Get your free report, "Pandemonium in the Stock Market," now to learn what's behind the market chaos and what's next. It's adapted directly from two subscriber-level services, Bob Prechter's Elliott Wave Theorist and the EWI Financial Forecast. |
This article was syndicated by Elliott Wave International and was originally published under the headline . EWI is the world's largest market forecasting firm. Its staff of full-time analysts led by Chartered Market Technician Robert Prechter provides 24-hour-a-day market analysis to institutional and private investors around the world.
About the Publisher, Elliott Wave International
Founded in 1979 by Robert R. Prechter Jr., Elliott Wave International (EWI) is the world's largest market forecasting firm. Its staff of full-time analysts provides 24-hour-a-day market analysis to institutional and private investors around the world.
© 2005-2022 http://www.MarketOracle.co.uk - The Market Oracle is a FREE Daily Financial Markets Analysis & Forecasting online publication.


