Case Shiller Futures Suggest 2010 US Housing Market Bottom
Housing-Market / US Housing Jun 25, 2008 - 09:38 AM GMTBy: Mike_Shedlock

 The April S&P/Case-Shiller Home Price Indices are now out.
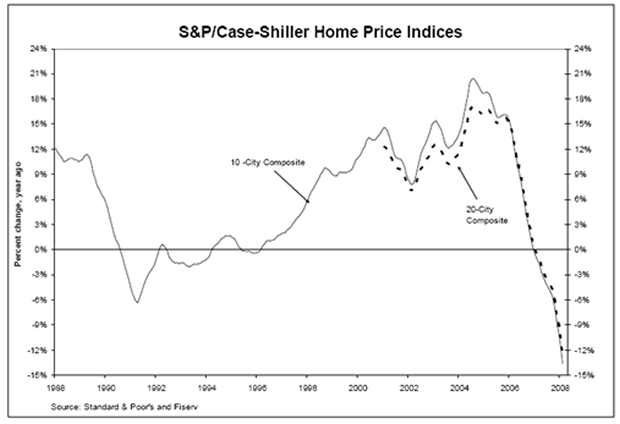
The index shows show annual declines in the prices of existing single family homes across the United States continued to worsen in April 2008, with all 20 MSAs now posting annual declines, 13 of which are posting record low annual declines, and 10 of which are in double-digits.

The 10-City Composite posted a new record low of -16.3%, and the 20-City Composite recorded a record low of -15.3%. All 20 MSAs are now showing declines with Charlotte, the last holdout during the 2007/early 2008 period, now reporting an annual decline of 0.1%. Calculated Risk has charts of Los Angeles and Minneapolis in his report Case-Shiller: Tiered Home Price Indices .
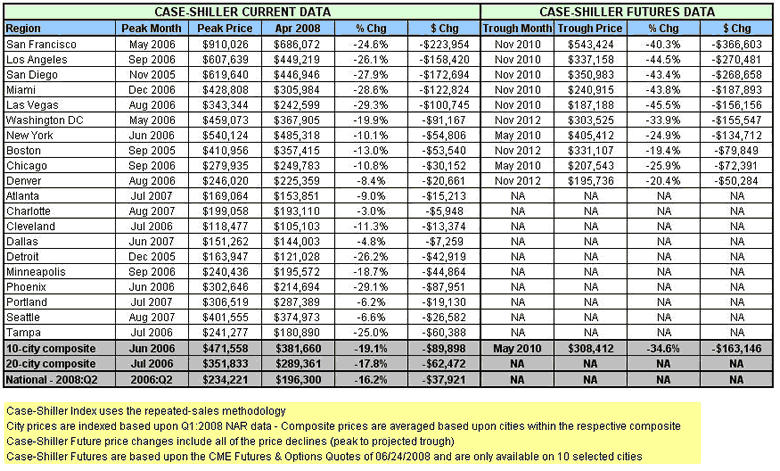
The following chart was produced by "TC" who has been monitoring C.A.R. data, DQNews data, and Case-Shiller Data. Let's take a look.

"TC" writes:
Mish, it's TC here and it's now been 2 months since I last provided you with a Case-Shiller update. Here is the latest data based upon the today's futures market and today's Case-Shiller data release.
As you've now seen in the media press releases, prices have continued lower and we're now back to late 2003/early 2004 prices in many areas. What you may not hear in the media however is the pure dollar amounts of the losses (e.g. $270k in LA) and that the futures market is increasingly making a bet that mid to late 2010 will mark the housing bottom.
This is in stark contrast to the bets of just 4 months ago when a bottom forecast for 2013. An interesting fact about this market timing change is that projected percentage decline has not changed. In other words the futures market is pricing in an identical magnitude loss, but just for it to happen much faster. Click here for the previous chart from TC , from two months ago. That chart is suggesting a November 2012 bottom.
The futures might be suggesting a 2010 bottom but I am doubting it. This recession will be much longer and much more severe than most thinks. See Case for an "L" Shaped Recession .
Unemployment is going to soar and unemployment will keep climbing for as long as a year after the recession ends. Unemployment is typically a lagging indicator. And unemployed people are not going to be buying many houses.
There is a strong possibility of a multi-dip recession as well. In other words, in and out of recession for a number of years. This is what happened in Japan. That is my forecast actually, but for lack of a better word I am calling that an "L".
I am sticking with 2012 for reasons outlined in When Will Housing Bottom? and Housing Bottom Nowhere in Sight .
However, much will depend on how fast banks can unload REOs, how fast rising unemployment adds news REOs, whether Congress does something insane like nationalize Fannie Mae, and many other factors that can change the nature and shape of the housing bottom.
By Mike "Mish" Shedlock
http://globaleconomicanalysis.blogspot.com
Click Here To Scroll Thru My Recent Post List
Mike Shedlock / Mish is a registered investment advisor representative for SitkaPacific Capital Management . Sitka Pacific is an asset management firm whose goal is strong performance and low volatility, regardless of market direction.
Visit Sitka Pacific's Account Management Page to learn more about wealth management and capital preservation strategies of Sitka Pacific.
I do weekly podcasts every Thursday on HoweStreet and a brief 7 minute segment on Saturday on CKNW AM 980 in Vancouver.
When not writing about stocks or the economy I spends a great deal of time on photography and in the garden. I have over 80 magazine and book cover credits. Some of my Wisconsin and gardening images can be seen at MichaelShedlock.com .
© 2008 Mike Shedlock, All Rights Reserved
Mike Shedlock Archive |
© 2005-2022 http://www.MarketOracle.co.uk - The Market Oracle is a FREE Daily Financial Markets Analysis & Forecasting online publication.


