


Stock Market Crash Red Alert for 2nd Downwave...
Stock-Markets / Financial Crash Aug 31, 2015 - 08:03 AM GMTBy: Clive_Maund

 We are believed to be at an excellent juncture right now to short the broad stockmarket (or buy bear ETFs and Puts). As we know, we did just that before the dramatic plunge early last week, and are now "sitting pretty". Now is the time to add to positions, or if you haven't any and are looking for the right shorting opportunity, this is it.
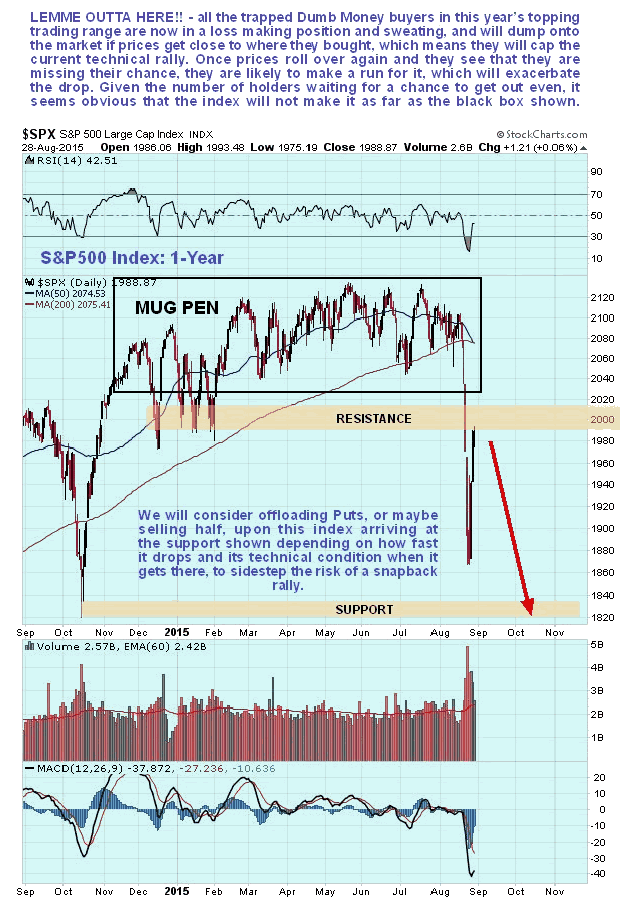
To see just why now is an excellent time to enter short positions or build on existing short positions (inverse ETFs / Puts) we will now look at the latest 1-year chart for the S&P500 index. All those who bought in the large rectangular pattern drawn on the chart, labeled the "Mug Pen" are like sheep huddled in a corral waiting to be fleeced. Even after the sharp rally late last week they are nursing significant losses, and if they get the chance to "get out even" or nearly so, they are going to take it. What is likely to happen is that they will almost get the chance, but not quite, because the market will turn down again soon, or immediately, and they will have to make a run for it if they want to avoid a severe fleecing. This means that as soon as the market starts to drop away again, they will stampede to unload stocks while they still can at reasonable prices, exacerbating the rate of decline. This is a big reason that another severe downleg is expected.
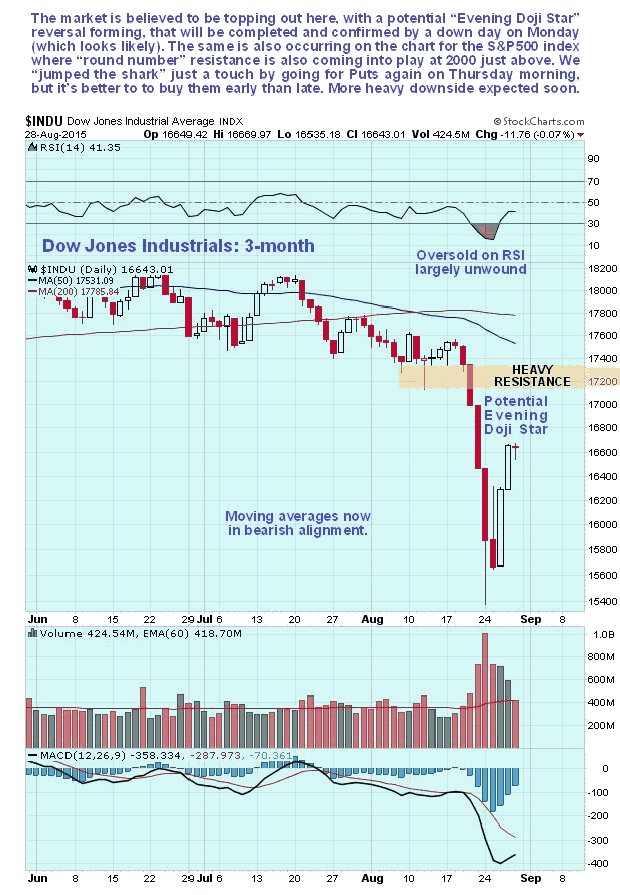
On the 3-month chart for the Dow Jones Industrials we can see recent action in detail, and how the market may right now be topping after the technical rebound last week, with a potential "Evening Doji Star" reversal forming on the chart, that will be confirmed by a drop tomorrow...
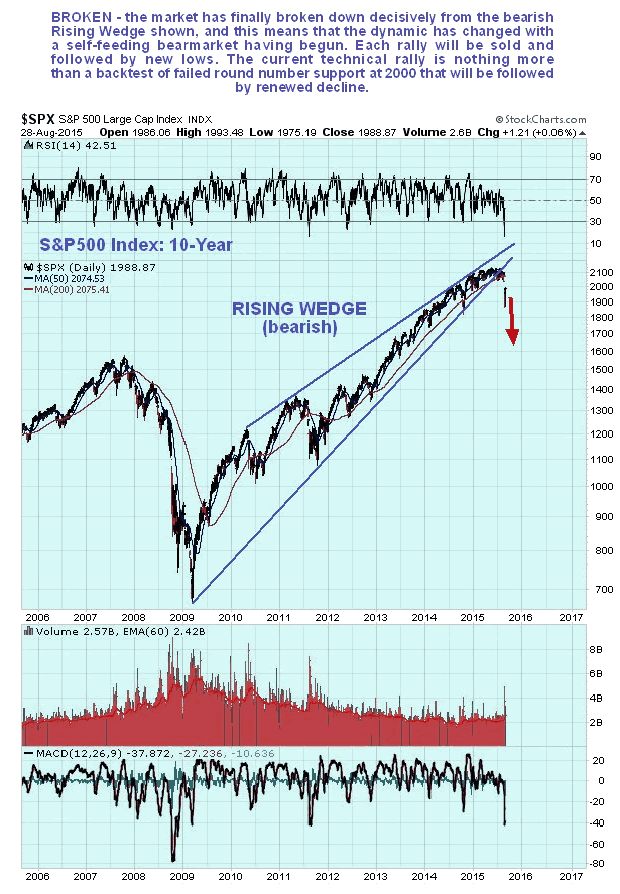
The seriousness of the situation is made clear by the long-term 10-year chart for the S&P500 index on which we can see that a long overdue cyclical bearmarket has been signaled by last week's plunge, which involved a clear breakdown from a large bearish Rising Wedge. What we are seeing now is a final backtest of the "round number" resistance at 2000, formerly support that failed, before we enter a brutal self-feeding downtrend that is likely to be steep. This looks like the last opportunity to get out, or go short at good prices. Those who follow Wall St's advice to "buy selectively" will learn to their dismay that the market doesn't discriminate much when it comes to the damage it inflicts during a severe bearmarket phase - pretty much everything will be hit and hard.
For those who are experienced and comfortable with trading options, a wide range of suitable big stock Puts are detailed in two articles on the site, Big Stock Put Options for Market Crash - Round 2 and Big Stock Put Options for Market Crash - worthy additions.
By Clive Maund
CliveMaund.com
For billing & subscription questions: subscriptions@clivemaund.com
© 2015 Clive Maund - The above represents the opinion and analysis of Mr. Maund, based on data available to him, at the time of writing. Mr. Maunds opinions are his own, and are not a recommendation or an offer to buy or sell securities. No responsibility can be accepted for losses that may result as a consequence of trading on the basis of this analysis.
Mr. Maund is an independent analyst who receives no compensation of any kind from any groups, individuals or corporations mentioned in his reports. As trading and investing in any financial markets may involve serious risk of loss, Mr. Maund recommends that you consult with a qualified investment advisor, one licensed by appropriate regulatory agencies in your legal jurisdiction and do your own due diligence and research when making any kind of a transaction with financial ramifications.
Clive Maund Archive |
© 2005-2022 http://www.MarketOracle.co.uk - The Market Oracle is a FREE Daily Financial Markets Analysis & Forecasting online publication.