Why Monday’s Stock Market Mayhem Was No Surprise
Stock-Markets / Stock Markets 2015 Aug 29, 2015 - 03:27 PM GMTBy: Investment_U
Anthony Summers writes: After a week of steady declines, investors woke up Monday morning to a huge sell-off as both the S&P and Dow dropped hugely in the early minutes of trading.
The Dow plummeted nearly 4% before seeing its largest intraday point swing ever. The spread between the high and low of the day? An astonishing 1,089 points.

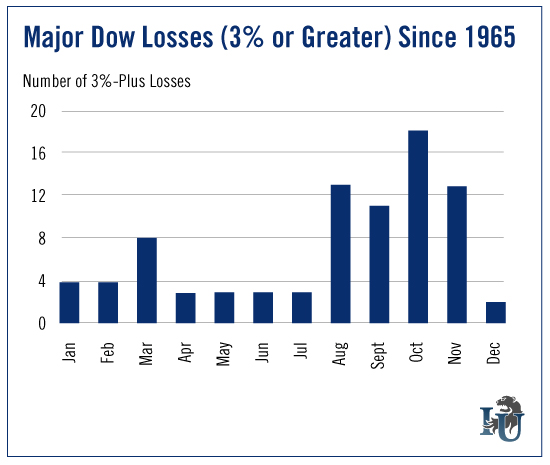
On the heels of this historic market activity, today’s chart looks at the Dow’s largest percentage losses - and the months when they were most common. This bird’s-eye view of market volatility should help us form realistic expectations for the coming months.
To create our chart, we took historical price data for the Dow going back to 1965. We then filtered the data for daily percentage losses of 3% or higher.
As you can see, the largest percentage losses in the market tend to occur between August and November. Of the 20 largest losses in the past 50 years, eight occurred in the month of October.
In his most recent article, Emerging Trends Strategist Matthew Carr noted that of the 20 largest point losses in market history, six were during the month of August.
In other words, big losses this time of year are nothing new for the market. But there is good news...
Six months after these large single-day losses, the market is typically up 5% on average - which means the volatile days and weeks ahead could actually be good for your portfolio. According to Matthew, “now is the time you should be hunting for opportunities, zeroing in on those companies that are oversold.”
If nothing else, investors should take comfort in knowing that there’s some predictability to all this market madness.
One final note...
In pulling together the data for this week’s chart, I stumbled upon another interesting monthly trend. It’s really quite surprising. In fact, it may just change your investment outlook for the rest of 2015.
Stay tuned. I’ll share that with you next week.
Good investing,
Anthony
Copyright © 1999 - 2015 by The Oxford Club, L.L.C All Rights Reserved. Protected by copyright laws of the United States and international treaties. Any reproduction, copying, or redistribution (electronic or otherwise, including on the world wide web), of content from this website, in whole or in part, is strictly prohibited without the express written permission of Investment U, Attn: Member Services , 105 West Monument Street, Baltimore, MD 21201 Email: CustomerService@InvestmentU.com
Disclaimer: Investment U Disclaimer: Nothing published by Investment U should be considered personalized investment advice. Although our employees may answer your general customer service questions, they are not licensed under securities laws to address your particular investment situation. No communication by our employees to you should be deemed as personalized investment advice. We expressly forbid our writers from having a financial interest in any security recommended to our readers. All of our employees and agents must wait 24 hours after on-line publication or 72 hours after the mailing of printed-only publication prior to following an initial recommendation. Any investments recommended by Investment U should be made only after consulting with your investment advisor and only after reviewing the prospectus or financial statements of the company.
Investment U Archive |
© 2005-2022 http://www.MarketOracle.co.uk - The Market Oracle is a FREE Daily Financial Markets Analysis & Forecasting online publication.


