US Housing recession increasing risks of US Economic recession as growth continues to slow
Economics / US Economy Mar 14, 2007 - 01:31 AM GMTBy: Paul_L_Kasriel
Three quarters of below potential growth and counting.
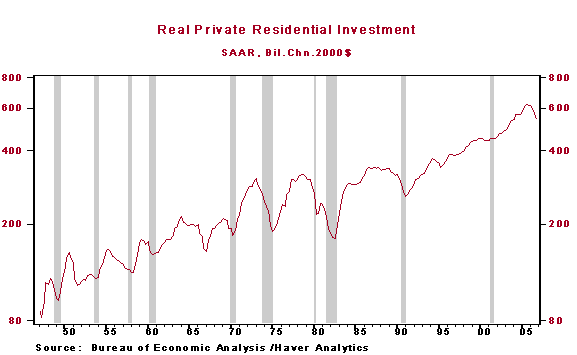
As everyone knows, the housing recession is the biggest drag on the pace of economic activity right now. But is the housing recession at its bottom? And more importantly, are there negative multiplier effects emanating from the housing recession? With regard to whether the housing recession has hit bottom; it is doubtful. In an average housing downturn, real residential investment expenditures decline by about 25% peak to trough.
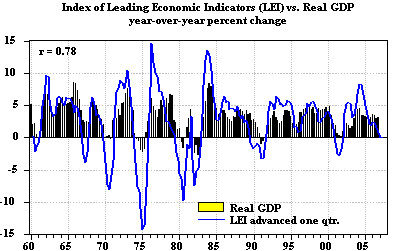
Chart 1
As Chart 2 shows, through the fourth quarter 2006, these expenditures have fallen by only about 13%, or slightly more than half of an average housing recession.
Chart 2
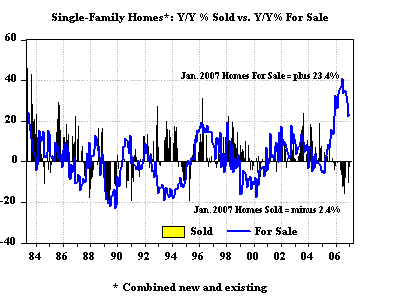
The current supply of single-family houses for sale – both new and existing – continues to outpace by a wide margin the current demand for them. Chart 3 shows that in January, single-family homes for sale were up 23.4% year over year while single-family homes sold were down 2.4%. The supply-demand situation probably is even more out of balance than these data show inasmuch as cancellations of new home sales are netted out of sales and are not added back into inventories for sale.
Chart 3
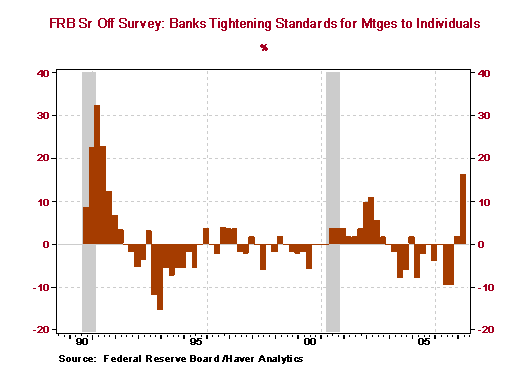
The deterioration in the subprime residential mortgage market has hit the front pages of many newspapers. At least two dozen subprime mortgage lenders have closed their shops (boiler rooms?) since December. Many survivors are tightening their underwriting standards. For some, that means instituting some standards other than just the detection of a pulse for the mortgage applicant. Commercial banks are tightening their underwriting standards for residential mortgages in general, as evidenced by the most recent Federal Reserve survey of bank lending terms. As shown in Chart 4, a net 15% of bank respondents reported they had tightened their lending standards for residential mortgages - the largest percentage since the second quarter 1991. There does not seem to be any definitive source on the size of the subprime mortgage market. Bank of America estimates that subprime mortgages account for about 14% of total outstanding mortgages and Alt-A mortgages account for about 27%. Alt-A mortgages lie between prime and subprime. Many Alt-A mortgages were issued to individuals with good credit ratings but who chose to borrow at somewhat higher interest rates than prime borrowers because they did not want to disclose their current incomes or intended to finance a house/condo for investment purposes. Delinquencies in the Alt-A sector also are starting to rise faster than expected.
Chart 4
The tightening of residential mortgage standards will increase the inventories of homes for sale and adversely affect the demand for them. The tightening standards will increase the inventory of homes for sale as foreclosures rise because some borrowers will not be able to afford their stepped-up monthly mortgage payments after the “teaser” interest rates have expired and will not qualify for a new mortgage with lower monthly payments. According to CreditSights, defaults/foreclosures in the subprime market alone will add an additional 500,000 housing units to the inventory of homes for sale. This is approximately equal to the current inventory of unsold new single-family homes. Demand will be adversely affected because fewer first-time and move-up buyers will qualify for mortgages as compared with recent years. According to Bear Stearns, the tightening of subprime lending standards could shut out approximately 1.1 million households from becoming homeowners, or at least renters with options to buy. In sum, it is doubtful the housing recession is over.
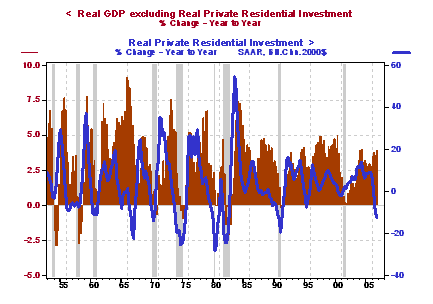
Now to the issue of whether what happens in housing stays in housing? Housing as a sector historically has led the rest of the economy. Chart 5 shows that the peaks and troughs in the year-over-year change in real private residential investment expenditures lead the peaks and troughs in the year-over-year change in real GDP excluding residential investment. The highest correlation between the two series is obtained when residential investment leads by two quarters. So, even if the current housing recession were at its bottom, its full impact still has not transferred to the rest of the economy.
Chart 5
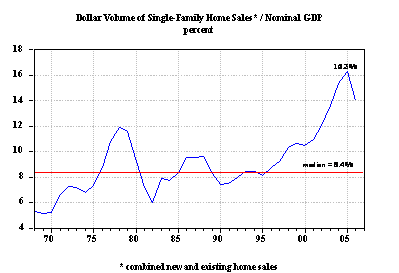
Housing activity seems to have played an extraordinarily (oh, how we miss Greenspanish) large role in the current economic expansion. One way to gauge this is to calculate the dollar volume of single-family home sales as a percentage of nominal GDP. Chart 6 contains such calculations. In the current expansion, the dollar volume of single-family home sales rose rapidly relative to nominal GDP, hitting a record high of 16.3% in 2005. The median percentage from 1968 through 2006 is only 8.4. It strains credulity to think that such large relative activity in the housing sector in this expansion would not have a significant negative multiplier effect on the rest of the economy now that housing has entered a recession.
Chart 6
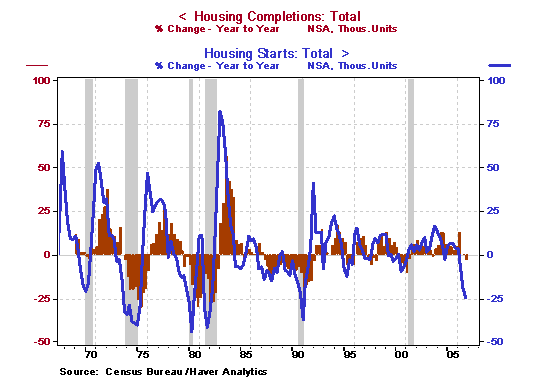
Housing starts lead housing completions, as shown in Chart 7. On a year-over-year change basis, starts lead completions by about two quarters. Thus, a sharp drop in housing completions should be expected in the coming quarters, given the sharp decline in housing starts. There is little value added in starting a house. The value added and employment rise throughout the “gestation” period of construction of the house.
Chart 7
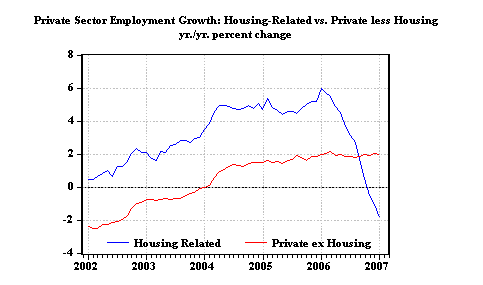
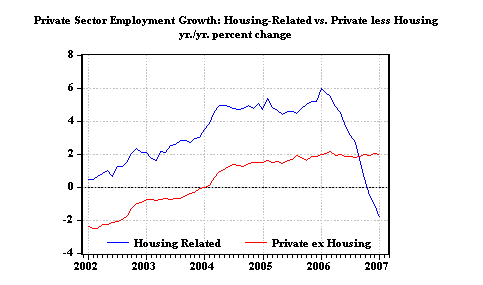
With the expected sharp drop in completions, housing-related employment also can be expected to fall sharply, which will negatively impact total private-sector employment. Chart 8 shows that the year-over-year change in housing-related employment peaked in January 2006 at 6.0% and was contracting 1.8% by January 2007. Again as housing completions plummet in the months ahead, so too will housing-related employment as trades people are laid off, furniture and appliance manufacturing contracts and more mortgage brokers seek alternative employment. Year-over-year growth in private-sector employment excluding housing-related appears to have peaked in March 2006 at 2.2%, slipping to 2.0% in January 2007. Housing-related employment growth tends to lead private-sector employment growth excluding housing-related by about four months. Therefore, as housing-related employment begins to contract more significantly in the immediate months ahead, employment growth in the rest of the private sector will also start to slow significantly. And the slowdown in employment growth will have a moderating effect on the growth in personal consumption.
Chart 8
Before leaving the subject of employment, we want to comment on the February employment report. Despite what else you might have read, we believe it was unambiguously weak. Private nonfarm payrolls rose a scant 58,000 – the weakest increase since November 2004. The year-over-year increase in February private payrolls was 1.5%, down from a peak of 2.4% reached in March 2006 and the slowest increase since September 2004. Similarly, the Household Survey of nonagricultural employment was weak. In February, the Household Survey showed a net decrease of 283,000 nonag private sector wage and salary workers outside of household employment. The year-over-year growth in this category was 1.4%, down from a cyclical peak growth of 2.9% set in March 2006 and the slowest growth since May 2005. A lot was made of the “fact” that the unemployment rate fell a tick to 4.5%. But the decline in the labor force by 190,000 helped bias downward the unemployment rate. In addition, the participation rate (the labor force as a percent of civilian noninstitutional population) declined to 66.2% – the second consecutive monthly decline. Moreover, the percent of the unemployed who previously had jobs but were laid off, as compared with those unemployed who had either reentered the labor force or entered for the first time, increased to 50.1% from a cycle low of 46.0% (October 2006) and registered the highest reading since January 2005. These layoff data from the Household Survey corroborate the behavior of initial claims for unemployment insurance. Chart 9 shows that the year-over-year change in initial unemployment claims was up 11.4% in February. If the Katrina-induced September 2005 spike in new claims is excluded, the February increase is the largest since January 2002. By the way, initial jobless claims are a component of the LEI.
Chart 9
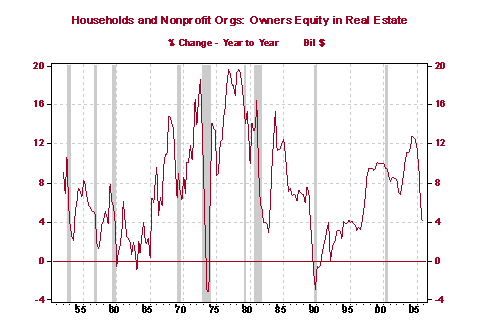
Back to the negative multiplier effect from the current housing recession. In addition to wage and salary income, another factor financing consumer spending in this cycle has been mortgage equity withdrawal (MEW) from homes. We and others have referred to this as the “in-home automated teller machine” (ATM). Well, the in-home ATM is not filling up as fast these days as it has in recent years. The excess supply of houses has led to a sharp year-over-year decline in the median price of a single-family home, as can be seen in Chart 10. In January, the year-over-year change in the median blended price of a single-family home was minus 3.6%, a larger contraction in the price than occurred in 1990, when the economy was in a recession and S&Ls were closing as fast as subprime mortgage lenders are now. The decline in house prices along with the explosion in negative amortizing mortgages implies that the growth in homeowner equity would slow. And sure enough, as shown in Chart 11, this is exactly what is happening. In the fourth quarter 2006, the year-over-year change in homeowner equity was 4.05% - the slowest growth since 1997.
Chart 10
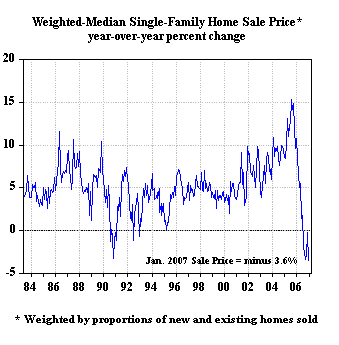
Chart 11
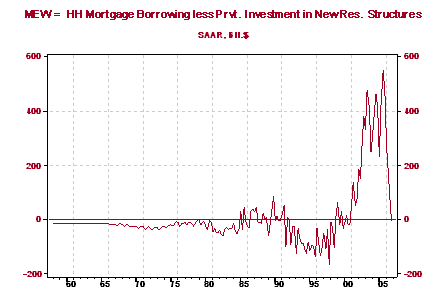
There probably are as many different calculations of MEW as there are economists. Our preferred calculation is the difference between household mortgage borrowing and the amount of private residential investment expenditures for new houses and condos. If mortgage borrowing is greater than these investment expenditures, then the implication is that households are borrowing to extract equity in order to buy big screen TVs, granite kitchen countertops, financial assets and/or pay down other types of household debt. (The fact that households' total debt keeps rising as a percent of the market value of their total assets suggests that on net, there is no debt reduction taking place.) Chart 12 shows our rendition of MEW. MEW peaked at an annualized $553 billion in third quarter 2005 and was contracting at an annualized pace of $5 billion in fourth quarter 2006. Now others' calculation of MEW may show different dollar amounts than ours, but most will show a sharp slowdown in MEW, as our does. The implication of all this is that an important source of financing for consumer spending has disappeared. Thus, growth in consumer spending is set to moderate as a result.
Chart 12
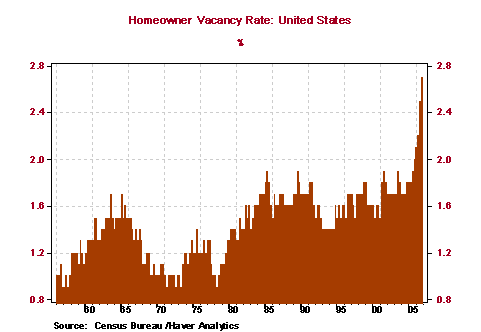
Let's turn to inflation. Barring a sharp spike in energy prices as a result of a spread in the conflict in the Middle East to include Iran, the overall rate of inflation is well past its cyclical peak, which occurred in September 2005 on a year-over-year basis. Core inflation, i.e., overall inflation excluding food and energy components, also looks as though it has peaked cyclically (see Chart 13). The largest upward pressure on core inflation is coming from the prices of consumer services, not the prices of consumer goods (see Chart 14). And a major factor pushing up the prices of consumer services is rent of shelter (see Chart 15). But with a record number and percentage of potentially owner-occupied houses and condos being vacant and more supply in the pipeline (see Chart 16), it is quite likely that the rate of increase in the rent of shelter will be slowing as 2007 progresses. Therefore, we believe that the rate of core inflation, the concept of inflation most relevant (rightly or wrongly) for FOMC policy decisions, will be moderating further this year.
Chart 13
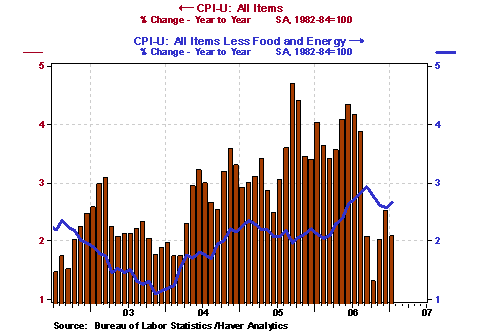
Chart 14
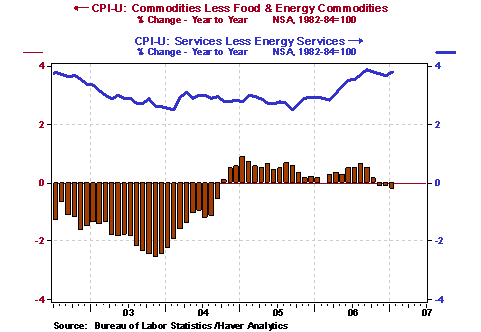
Chart 15
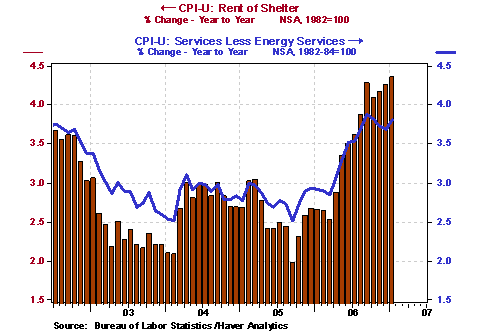
Chart 16
Whenever we refer to the Consumer Price Index (CPI) or other government measure of goods/services prices, we get angry emails accusing us of being stooges for the government's “lies.” Our response is twofold. First, if the government is so obviously understating the “true” rate of increase in the prices of goods/services, why are nominal interest rates on U.S. government debt so low? After all, is there a class of people more sensitive to inflation and more cynical than bond traders? Second, if the FOMC bases its policy decisions on the official inflation measures and we are trying to forecast future Federal Reserve policy actions, then we, too, should pay attention the official data whether or not we think they are valid.
The current FOMC is made up of young economic idealists and veterans of the war against the Great Inflation of the 1970s. The young idealists believe that if inflation is kept low and steady, eventually all things good will occur in the economy. The Great Inflation veterans say, “Never again!” So, we do not for a minute believe that this group is “soft” on inflation. But the group surely is aware that inflation is a lagging cyclical process. Although currently the FOMC is not entertaining a decline in the federal funds rate, we believe that it will around midyear as it sees real economic growth continuing below its potential rate, the unemployment rate creeping up and core inflation edging lower. Therefore, we believe the FOMC will feel the need to take out a little anti-recession insurance by starting to cut the federal funds rate at its August 7 meeting. We are not saying that this is a correct or incorrect policy move. We are just saying that this is what we think the FOMC will do.
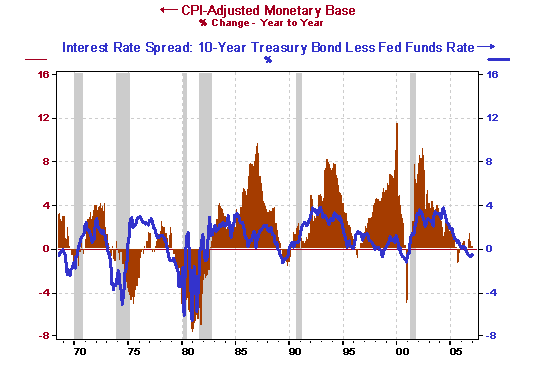
One final note (we promise!). We frequently are asked what the odds of a recession are in the next 12 months. We don't know the answer. But we do know that every recession starting with the 1970 one was immediately preceded by the combination of a negative spread between the yield on the 10-year Treasury security and the federal funds rate and the year-over-year contraction in the CPI-adjusted monetary base (bank reserves plus currency). This is illustrated in Chart 17. As of January, the yield spread was negative, but the change in the CPI-adjusted monetary base was positive – barely, at 0.33%. As of February, the yield spread still was negative. We will have to await the release of the February CPI on Friday, March 16, to see if the change in the real monetary base is positive. The year-over-year change in the nominal monetary base in February was 1.9%. Our estimate of the February year-over-year change in the all-items CPI is 2.2%. The consensus estimate is 2.3%. Unless there is a downside surprise in the February CPI, it looks as though the recession-warning combination of a negative yield spread and a contracting real monetary base will occur. Now, prior to past recessions, this combination persisted for several months with larger magnitudes than are likely to exist after Friday's CPI report. But we do not see the yield spread turning positive anytime soon. Moreover, with mortgage credit growth in the months ahead likely to slow even more than it already has due to the subprime problems, growth in the nominal monetary base is unlikely to accelerate. Beware!
Chart 17
*Paul Kasriel is the recipient of the 2006 Lawrence R. Klein Award for Blue Chip Forecasting Accuracy
THE NORTHERN TRUST COMPANY
ECONOMIC RESEARCH DEPARTMENT
March 2007
SELECTED BUSINESS INDICATORS
Table 1 US GDP, Inflation, and Unemployment Rate
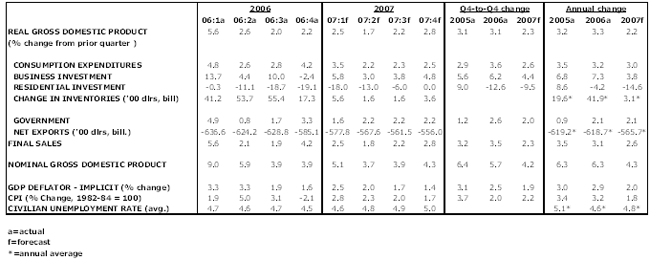
Table 2 Outlook for Interest Rates

By Paul Kasriel
The Northern Trust Company
Economic Research Department - Daily Global Commentary
Copyright © 2007 Paul Kasriel
Paul joined the economic research unit of The Northern Trust Company in 1986 as Vice President and Economist, being named Senior Vice President and Director of Economic Research in 2000. His economic and interest rate forecasts are used both internally and by clients. The accuracy of the Economic Research Department's forecasts has consistently been highly-ranked in the Blue Chip survey of about 50 forecasters over the years. To that point, Paul received the prestigious 2006 Lawrence R. Klein Award for having the most accurate economic forecast among the Blue Chip survey participants for the years 2002 through 2005.
The opinions expressed herein are those of the author and do not necessarily represent the views of The Northern Trust Company. The Northern Trust Company does not warrant the accuracy or completeness of information contained herein, such information is subject to change and is not intended to influence your investment decisions.
© 2005-2022 http://www.MarketOracle.co.uk - The Market Oracle is a FREE Daily Financial Markets Analysis & Forecasting online publication.


