


Stocks Correct, Panic Ensues. The End Of The World?
Stock-Markets / Stock Markets 2015 Aug 24, 2015 - 10:35 AM GMTBy: SecularInvestor

 The four major U.S. stock market indices finally corrected after a 9-month sideways trend. The ‘big’ news this week for stocks was undoubtedly that the four indices all closed below their 200-day moving average, which IS an important breakdown.
At Secular Investor, we believe the TED-spread is one of the most reliable indicators of stress in the financial system. It should be considered a ‘seismograph’ signaling that something is brewing, as explained some time ago here.
The TED-spread has ‘broken out’ this week, after a steady rise for a year and a half. It now has the highest reading since ‘QE infinity’ started at the end of 2012.
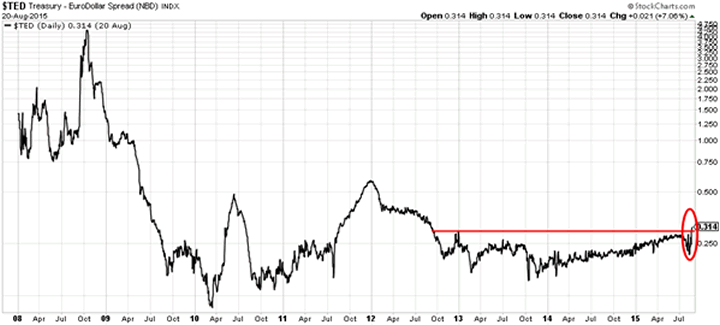
That clearly does not bode well, given interest rates at all-time lows, the end of quantitative easing in the U.S., and one trillion Euro QE program running in Europe.
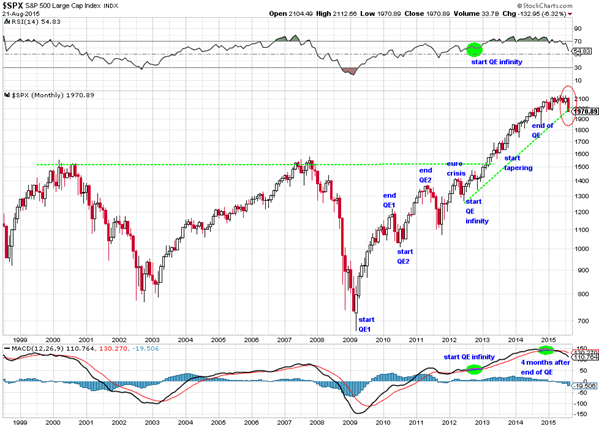
The long term S&P 500 chart reflects the deteriorating conditions signaled by the TED-spread. The key observation on that chart is the violation of the steep uptrend (highlighted with the rising green dotted line), which started with the announcement of the ‘QE infinity’ program in the autumn of 2012. We have marked the violation of the uptrend with a red circle. Make no mistake, this is a major event, with potentially a big impact.
One thing is clear: the central bank driven QE program had a one-to-one correlation with the stock market. With a supposed ‘recovery of the economy’ it will be interesting to see how deep this correction will go, and how the central banks will handle the correction. Is QE4 around the corner? Are we about to experience a Japan-style monetary stimulus leading the debt to GDP ratio to stratospheric levels?
The chart below suggests caution. Note that the MACD indicator fired a sell signal shortly after the ‘QE infinity’ program was ended. That was clearly a reliable early warning sign.
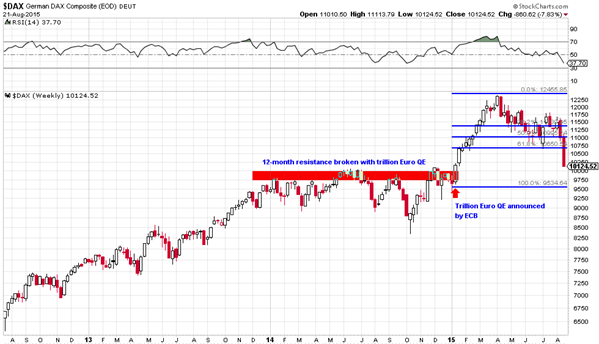
Europe is not doing better. The bellwether index in Europe, the German DAX, is back to its ‘pre-QE’ levels. The index has fully retraced the gains after a trillion Euro QE program was announced. Think about that! The biggest monetary stimulus in European history pushed the German index some 25% higher, in a matter of 4 months, breaking out of a 12-month consolidation, but then lost all those gains. The significant information here is that the QE program is still running at full force.
In the U.S. the S&P 500 trades ONLY 7% below its all-time high. But the optimism index has literally crashed to the lowest level since 2001. The chart below shows data going back to 2001, so this could be an all-time low. This week’s correction brought optimism down to levels even lower than the 2008 and 2009 collapse.
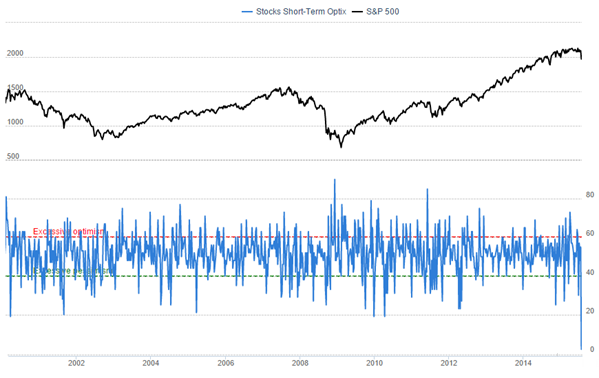
What will happen if stocks correct into a bear market and correct more than 20%? Will it be the end of the world?
On a more serious note, however, the precious metals market is getting very interesting. Gold filled the gap after breaking down below $1,135 in July. This is a strong performance and important for chart analysis.
But didn’t most financial insitutions, investment banks, market experts, and other pundits, predict that gold would fall below $1,000 /oz? What about their forecasts?
Consider HSBC, who revised their gold price forecast upward this week, saying gold will be up 10% by the end of this year, worth around $1,225 an ounce.
Only three weeks ago, HSBC revised the gold price forecast downwards. On July 27th, the bank said that gold would average $1,160 per ounce in 2015 from $1,234 previously.
How meaningful are those forecasts?
From our perspective, the secular bull market in gold is resuming. We believe there is a fair chance that the trend change occurred two weeks ago, when China ‘de-pegged’ its currency from the U.S. dollar. Think about it, the second largest global economy said ‘goodbye’ to the dollar reserve currency. With their massive gold accumulation in recent years, China is more than ever relying on its ‘real’ monetary reserve, i.e. GOLD.
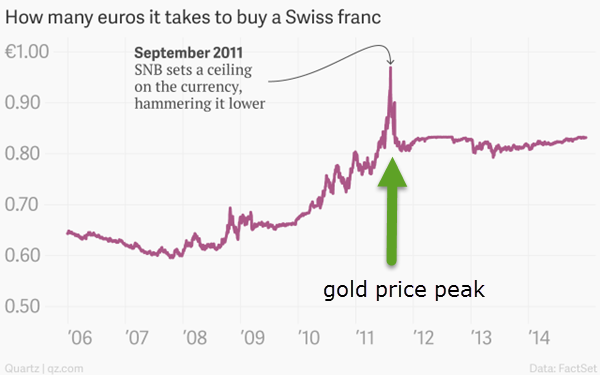
What happened with the Chinese currency is the opposite of what happened in September 2011. Uncoincidentally, the Swiss National Bank pegged its currency (the Swiss Franc) to the Euro exactly the same month the gold price peaked. The Swiss Franc, being a safe haven currency, was rising too rapidly … until the Swiss central bank decided to break that trend. Gold stopped rising in the same month. We believe China did the opposite and instigated the rise in gold prices two weeks ago.
Based on the latest COT data from Friday 21st, it seems that gold’s recent rally is only a warm-up. The key indicator in the COT is the net short position of commercial traders, and its rate of change. The good news for gold bulls is that the net short position of those commercial traders is at all-time lows, even after the rally of this month. That means, in our view, the rally has considerable upside potential. With stocks correcting, and stock market optimism index at all-time lows, we believe the potential money inflows into the gold market are significant enough to launch gold prices much higher!
At Secular Investor, we closely monitor all markets, and pay specific attention to the gold market, as it is the market with the highest potential when it comes to secular profits.
Secular Investor offers a fresh look at investing. We analyze long lasting cycles, coupled with a collection of strategic investments and concrete tips for different types of assets. The methods and strategies are transformed into the Gold & Silver Report and the Commodity Report.
Follow us on Facebook ;@SecularInvestor [NEW] and Twitter ;@SecularInvest
© 2015 Copyright Secular Investor - All Rights Reserved Disclaimer: The above is a matter of opinion provided for general information purposes only and is not intended as investment advice. Information and analysis above are derived from sources and utilising methods believed to be reliable, but we cannot accept responsibility for any losses you may incur as a result of this analysis. Individuals should consult with their personal financial advisors.
© 2005-2022 http://www.MarketOracle.co.uk - The Market Oracle is a FREE Daily Financial Markets Analysis & Forecasting online publication.