Don't Worry About a Return to 1970s Style Stagflation
Economics / Stagflation Jun 23, 2008 - 01:34 PM GMTBy: John_Derrick
Recent months have resurrected a potent economic villain of the past—stagflation.
The U.S. economy is seeing little to no growth, while at the same time inflation has risen to levels not seen in the better part of two decades due in large part to soaring food and energy prices.
How much should we fear stagflation now? Could we be looking at a replay of the pain and suffering of the Ford and Carter years?
While the current environment is trying for many consumers, we don't see it evolving into outright stagflation due to the relatively low inflation rate (by historic standards) and structural changes in the U.S. economy in recent decades that provide more protection from a damaging spiral.
For one thing, there's more flexibility in the economy as a result of improved technology, deregulation and increased competition that has resulted in more efficiencies.
A story from Bloomberg this week cites energy use as an example: Economic production in the U.S. in 2007 was 10 times greater than it was in 1973, but the nation's energy usage has risen by a third over that time period.
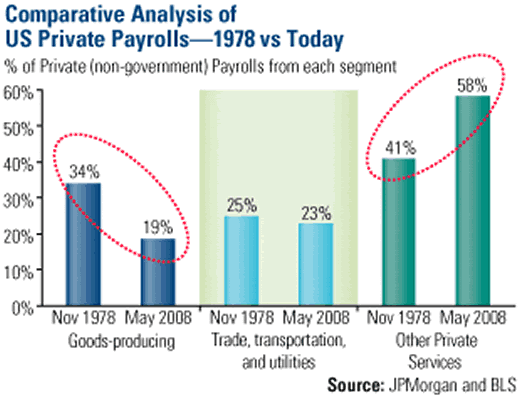
A big part of that energy efficiency is the continuing transition from manufacturing to services, which has also helped control inflation by keeping labor costs down.

Goods-producing jobs are now less than 20 percent of the national labor force, down from 34 percent three decades ago (see chart above). At the same time, the service sector has grown to 58 percent of all employment, up from 41 percent in 1978.
The manufacturing sector tends to be more volatile than the service sector because of its cyclical nature.
The history of the domestic car industry is a good example of this. Lower demand creates higher inventories, which leads to layoffs and plant closures as supply is cut back. When demand bounces back, more workers are hired as production is ramped up to increase supply. This works until demand again falls off.
Unionized labor accounted for 20 percent of the U.S. workforce in the early 1980s, but now that membership is down to about 12 percent, according to Bloomberg. And the percentage of unionized workers whose contracts include automatic cost-of-living raises is only 22 percent now, down from 61 percent in the mid-1970s.
In addition to these fundamental changes in the economy, there are other factors that reduce the risk of stagflation.
A big mitigator is the memory of what happened in the late 1970s—a brutal combination of double-digit inflation, double-digit interest rates, rising unemployment and falling output. The awareness of the negative impacts of stagflation will almost certainly lead top policymakers in the White House, at the Federal Reserve and on Capitol Hill to move quickly to head off stagflation, as we've already seen with the economic stimulus checks and interest rate cuts.
On top of that, exchange rates are far more flexible than they were several decades ago, and the surplus of worldwide labor will serve to hold down any upward pressure on wages.
By John Derrick, CFA
U.S. Global Investors
John Derrick, CFA, is director of research at U.S. Global Investors, which manages mutual funds specializing in natural resources, emerging markets and global infrastructure.
For more insights and perspective from the U.S. Global investment team, visit www.usfunds.com/franktalk .
All opinions expressed and data provided are subject to change without notice. Some of these opinions may not be appropriate to every investor. The S&P 500 Stock Index is a widely recognized capitalization-weighted index of 500 common stock prices in U.S. companies. The Goldman Sachs Commodity Index is a composite index of commodity sector returns, representing an unleveraged, long-only investment in commodity futures that is broadly diversified across the spectrum of commodities. Merrill Lynch U.S. Government Index tracks the performance of U.S.-dollar-denominated Treasury and Agency bonds issued in the domestic bond market. The MSCI EAFE ( Europe , Australia and Far East ) Index measures the performance of the leading stocks in 21 developed countries outside North America . There were no clients of U.S. Global Investors which held any of the securities mentioned in this article as of December 31, 2007.
John Derrick Archive |
© 2005-2022 http://www.MarketOracle.co.uk - The Market Oracle is a FREE Daily Financial Markets Analysis & Forecasting online publication.


