Global Stock Markets and Dow Jones Fire Warning Shot Across Investors Bow!
Stock-Markets / Stock Markets 2015 Aug 18, 2015 - 12:50 PM GMTBy: Chris_Vermeulen
 Last week, the global equity markets were quite undecided. China’s and Japan’s equity prices have been moving higher. The Japanese Nikkei reached its highest level since 1996 on Tuesday, August 11th, but then pulled back at the end of the week. Hong Kong’s Hang Seng made a new monthly low and the Australian Market fell to a new 6-month low.
Europe was more decisive. Traders mostly sold stocks. The German DAX, London FTSE, and Zurich SMI all fell to monthly lows by mid-week and did not recover much by Friday August 14th’s close. In Russia, it was much different. Moscow’s MICEX index rallied to its highest mark in 3 months.
In the US Markets, the selling was even more intense. On May 19th,2015, the DJIA topped out at 18,351. The DJIA has failed to make a new high since then and continues to sell off. The decline, so far, has been over 1,220 points which is its’ greatest loss of the year. Last week, began very strong, with the DJIA up 245 points on Monday, August 10th; Tuesday was down 212 points, and by Wednesday, the DJIA had fallen all the way to 17,125, its’ lowest level since February 2nd, 2015. We had a CONFIRMED BEARISH/SELL signal on August 4th, when the Dow Jones was at 17,596. Before I can take any BEARISH positions in the US Markets, this signal needs to be CONFIRMED by the SPX and the NDX-100 as BEARISH, which are currently NEUTRAL/TRENDLESS.
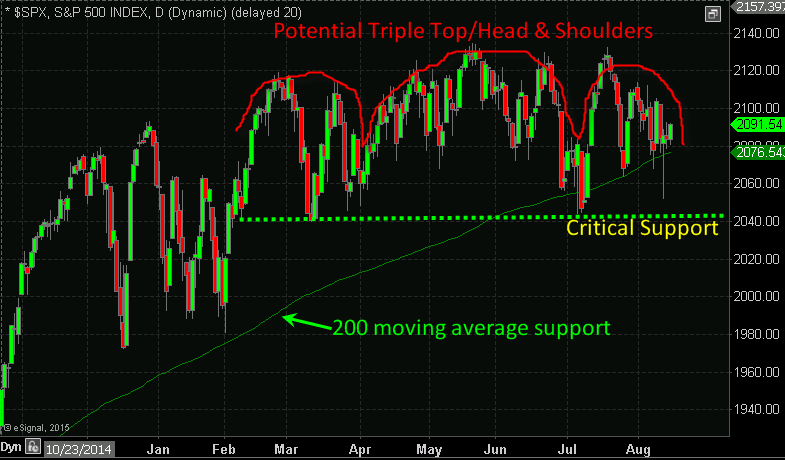
The SPX landed at support levels and found its’ footing, once again. We are getting closer to the cycle lows in September/October when the downward pressure will push it through its’ support trend lines. We are still into a sideways direction. It is a little too early to tell if it will continue the sideways motion or decline in some downward momentum, next week. SPX is undergoing a consolidation in a downtrend trend using the 200- Day Moving Average as support. A daily close below 2076, which does not hold, should bring about the next challenge to the 2040 major support level. The current declining patterns are represented in those of the DJIA,, NYSE and the Dow Jones Transportation Indexes.

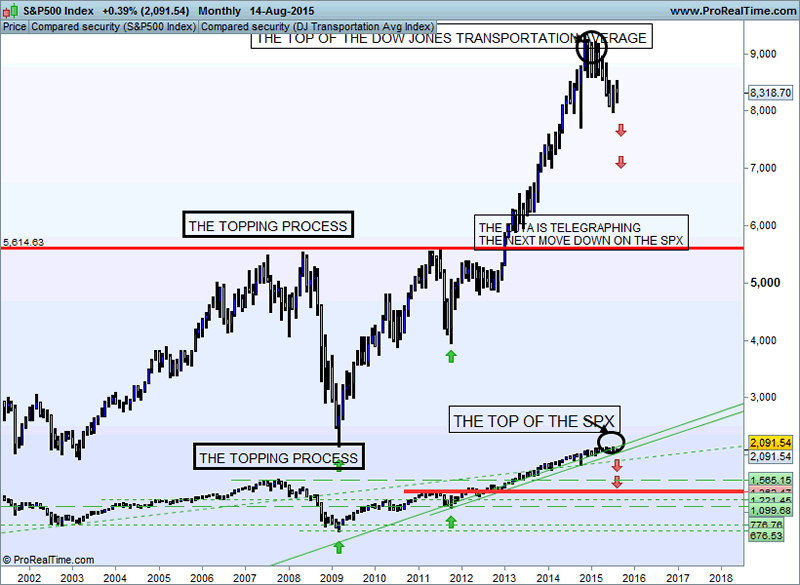
The Dow Jones Transportation Index and the Dow Jones Industrial Average are leading the US Markets down during this topping process They are declining further than the other indexes, and the other indexes should be establishing their downtrends, in the near future. With the exception of a monumental one-day market crash, that happens once in a blue moon, bull markets that are topping undergo a drawn-out process that usually takes, at least, many months before bearish momentum finally takes over and a new downtrend emerges.
Considering that US stocks have been in a 7-year bull market, it would be unreasonable to expect such bullish momentum to change overnight.
Therefore, even though price momentum has been favoring the bulls lately, it is still my belief, that it is dangerousto be invested on the long side of these markets, as of November 25th, 2014.
The stock market is undergoing a big trend change and most of the analysts are missing it, which is normal. They lack the access to “The Predictive Trend System Analytic’s” of a Financial Forecasting Model. My clients have the access to this knowledge from our subscription service that we provide. This knowledge provides you, the client, with THE EDGE that other professional investment firm’s lack.
U.S. equity markets have been fueled by cheap dollars and cheaper interest rates. The combination of the stock market crash from 2008 – 2009, along with a declining U.S. Dollar, has been destroyed by the Federal Reserve Bank (FRB), which has helped US Equities to become a bargain on the global market. This allowed foreign buyers to come in and purchase US Equities, at both a nominal value, based on the markets’ decline, as well as, a relative value based on their home currency. Foreign investors have capitalized on the rise in the US equity market
On November 25th, 2014 my **Global Sentiment Model signaled the “EXCESSIVE EXTREME OPTIMISM”, which provided an exit point on all long US Market positions . Those traders and investors, that remained in long positions, who were not subscribers to our service, at that time, have just been channeling, without any new break outs into new highs.
There is a huge disconnect between the popular sentiment, among the “talking heads” on the news, regarding how these events will affect the September 2015 meeting of the Federal Reserve Bank. The general consensus, that I feel currently exists, is that this could very well push any increase in interest rates, out into the year, 2016. The Federal Reserve Board of Governors has been decidedly dovish, regarding this aspect, and has continued its’ quantitative financial engineering.
INVESTOR SENTIMENT READINGS
High bullish readings in the sentiment stock index usually are signs of Market tops; low ones, market bottoms.
Last Week |
2 Weeks Ago | 3 Weeks Ago |
| AAII Index | ||||
| Bullish | 30.5% | 24.3% | 21.1% | |
| Bearish | 36.1 | 31.7 | 40.7 | |
| Neutral | 33.4 | 44.0 | 38.2 | |
| Source: American Association of Individual Investors, | ||||
Our current sentiment and technical features are consistent with a major stock market top. This model uses the market sentiment composite which is a measure of investor sentiment. This metric tracks the mood of investors, which is then translated into a probability whether the markets will advance or decline, within the near term, as well as, an undisclosed period of time. It is a contrarian indicator that produces a bullish signal, when market sentiment is overwhelmingly negative, and a bearish signal when markets are overwhelmingly bullish.
We have not disclosed these models’ methodology, and its statistical data, as it is proprietary. We have also not disclosed the correlation coefficient that is used to measure the strength of the linear dependence and its’ algorithms between the market sentiment composite and the 12-month forward return. A trading friend of mine developed this model thirty years ago. For the period of time that it has been implemented, which is now 25 years, it has been predicatively accurate, 100% of the time, prior to any major changes within the US Markets. The last signal that was generated was on November 25th, 2014, which registered “EXCESSIVE EXTREME OPTIMISM” and the broad market had been trading sideways since.
Learn how to read the market and make the same trades we do: www.TheGoldAndOilGuy.com
Chris Vermeulen
Join my email list FREE and get my next article which I will show you about a major opportunity in bonds and a rate spike – www.GoldAndOilGuy.com
Chris Vermeulen is Founder of the popular trading site TheGoldAndOilGuy.com. There he shares his highly successful, low-risk trading method. For 7 years Chris has been a leader in teaching others to skillfully trade in gold, oil, and silver in both bull and bear markets. Subscribers to his service depend on Chris' uniquely consistent investment opportunities that carry exceptionally low risk and high return.
Disclaimer: Nothing in this report should be construed as a solicitation to buy or sell any securities mentioned. Technical Traders Ltd., its owners and the author of this report are not registered broker-dealers or financial advisors. Before investing in any securities, you should consult with your financial advisor and a registered broker-dealer. Never make an investment based solely on what you read in an online or printed report, including this report, especially if the investment involves a small, thinly-traded company that isn’t well known. Technical Traders Ltd. and the author of this report has been paid by Cardiff Energy Corp. In addition, the author owns shares of Cardiff Energy Corp. and would also benefit from volume and price appreciation of its stock. The information provided here within should not be construed as a financial analysis but rather as an advertisement. The author’s views and opinions regarding the companies featured in reports are his own views and are based on information that he has researched independently and has received, which the author assumes to be reliable. Technical Traders Ltd. and the author of this report do not guarantee the accuracy, completeness, or usefulness of any content of this report, nor its fitness for any particular purpose. Lastly, the author does not guarantee that any of the companies mentioned in the reports will perform as expected, and any comparisons made to other companies may not be valid or come into effect.
Chris Vermeulen Archive |
© 2005-2022 http://www.MarketOracle.co.uk - The Market Oracle is a FREE Daily Financial Markets Analysis & Forecasting online publication.


