Most Popular
1. Banking Crisis is Stocks Bull Market Buying Opportunity - Nadeem_Walayat
2.The Crypto Signal for the Precious Metals Market - P_Radomski_CFA
3. One Possible Outcome to a New World Order - Raymond_Matison
4.Nvidia Blow Off Top - Flying High like the Phoenix too Close to the Sun - Nadeem_Walayat
5. Apple AAPL Stock Trend and Earnings Analysis - Nadeem_Walayat
6.AI, Stocks, and Gold Stocks – Connected After All - P_Radomski_CFA
7.Stock Market CHEAT SHEET - - Nadeem_Walayat
8.US Debt Ceiling Crisis Smoke and Mirrors Circus - Nadeem_Walayat
9.Silver Price May Explode - Avi_Gilburt
10.More US Banks Could Collapse -- A Lot More- EWI
Last 7 days
Stock Market Volatility (VIX) - 25th Mar 24
Stock Market Investor Sentiment - 25th Mar 24
The Federal Reserve Didn't Do Anything But It Had Plenty to Say - 25th Mar 24
Stock Market Breadth - 24th Mar 24
Stock Market Margin Debt Indicator - 24th Mar 24
It’s Easy to Scream Stocks Bubble! - 24th Mar 24
Stocks: What to Make of All This Insider Selling- 24th Mar 24
Money Supply Continues To Fall, Economy Worsens – Investors Don’t Care - 24th Mar 24
Get an Edge in the Crypto Market with Order Flow - 24th Mar 24
US Presidential Election Cycle and Recessions - 18th Mar 24
US Recession Already Happened in 2022! - 18th Mar 24
AI can now remember everything you say - 18th Mar 24
Bitcoin Crypto Mania 2024 - MicroStrategy MSTR Blow off Top! - 14th Mar 24
Bitcoin Gravy Train Trend Forecast 2024 - 11th Mar 24
Gold and the Long-Term Inflation Cycle - 11th Mar 24
Fed’s Next Intertest Rate Move might not align with popular consensus - 11th Mar 24
Two Reasons The Fed Manipulates Interest Rates - 11th Mar 24
US Dollar Trend 2024 - 9th Mar 2024
The Bond Trade and Interest Rates - 9th Mar 2024
Investors Don’t Believe the Gold Rally, Still Prefer General Stocks - 9th Mar 2024
Paper Gold Vs. Real Gold: It's Important to Know the Difference - 9th Mar 2024
Stocks: What This "Record Extreme" Indicator May Be Signaling - 9th Mar 2024
My 3 Favorite Trade Setups - Elliott Wave Course - 9th Mar 2024
Bitcoin Crypto Bubble Mania! - 4th Mar 2024
US Interest Rates - When WIll the Fed Pivot - 1st Mar 2024
S&P Stock Market Real Earnings Yield - 29th Feb 2024
US Unemployment is a Fake Statistic - 29th Feb 2024
U.S. financial market’s “Weimar phase” impact to your fiat and digital assets - 29th Feb 2024
What a Breakdown in Silver Mining Stocks! What an Opportunity! - 29th Feb 2024
Why AI will Soon become SA - Synthetic Intelligence - The Machine Learning Megatrend - 29th Feb 2024
Keep Calm and Carry on Buying Quantum AI Tech Stocks - 19th Feb 24

Market Oracle FREE Newsletter

How to Protect your Wealth by Investing in AI Tech Stocks

U.S. Stock Markets Analysis

Stock-Markets / Stock Markets 2015 Aug 15, 2015 - 12:51 PM GMT

By: Gary_Tanashian

Stock-Markets

Reviewing the US stock market picture from a few different angles...

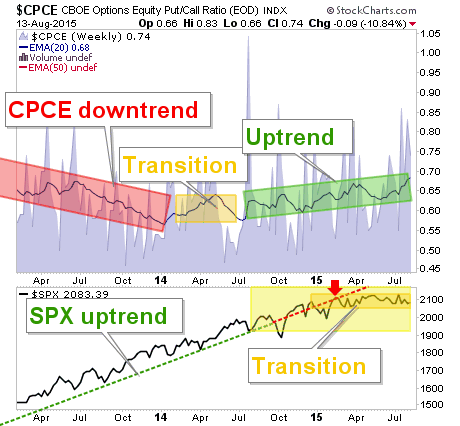
NFTRH been using the Equity Put/Call ratio to gauge pressure on the US stock market for all of 2015. Many people think that anxiety indicators like this and the VIX are contrary indicators (i.e. when they spike you buy the fear in the markets, which often does work well) but when smoothing out CPCE using a moving average (weekly EMA 20 in this case) you get a trend.

The market benefited over long stretches from the calm atmosphere and the down trend in put buying vs. call buying. One explanation is that the market felt safe in mommy and daddy's arms (Bernanke and Yellen, amidst 'peak confidence' in the Fed with a side of Goldilocks).


Then came transition and then came uptrend. The market has gone exactly sideways for all of 2015.

CBOE Options Equity Put/Call ratio Weekly Chart

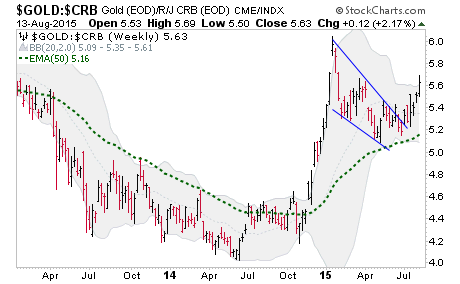
Meanwhile, gold is breaking out vs. commodities, so a counter-cyclical message is back in play. Now, this has not stopped the market yet, as the implication has been to this point, a Goldilocks scenario for the US.

Gold:CRB Weekly Chart

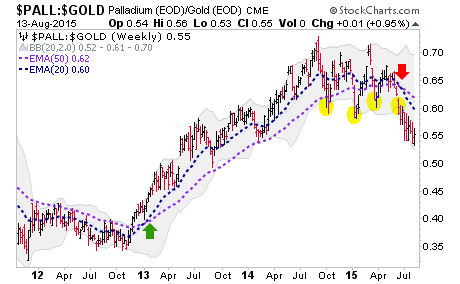
Except that this time Palladium-Gold ratio, a cyclical indicator, has joined its bearish fellow above, in making a counter-cyclical turn.

Palladium/Gold Ratio Weekly Chart

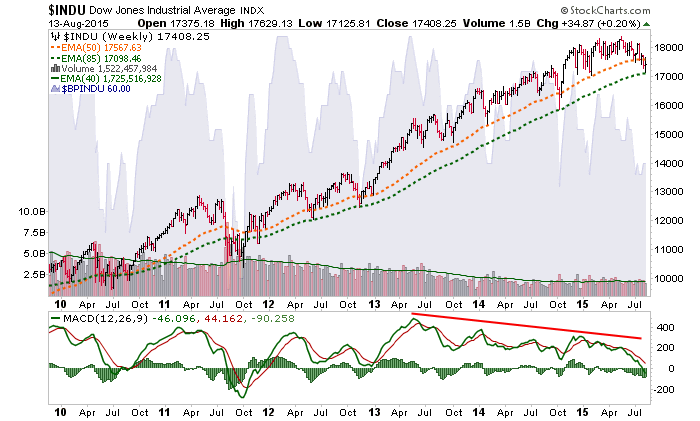
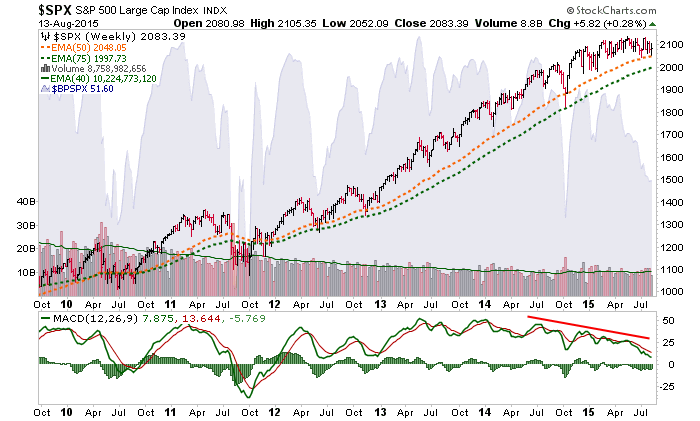
As long as the stock market's price is in an uptrend, which it is, then that is the primary ruler of things. The Dow is in an uptrend because it has not violated the October low and it is at the weekly EMA 85, which has supported every routine correction since 2011.

Bullish % (faded into background) is another of those indicators you could consider a contrary indicator, i.e. buy the correction, but there is one notable difference between this instance and the previous ones where BP declined; in this case BP (a measure of market participation) has ground lower while the Dow went sideways before recently dropping. Previously, BP has plunged in concert with corrections.

Dow Weekly Chart

S&P 500 is more egregious, as it is still sideways and only testing the the first key moving average. This is a very thinned out market as the majority of components have been weak.

S&P500 Weekly Chart

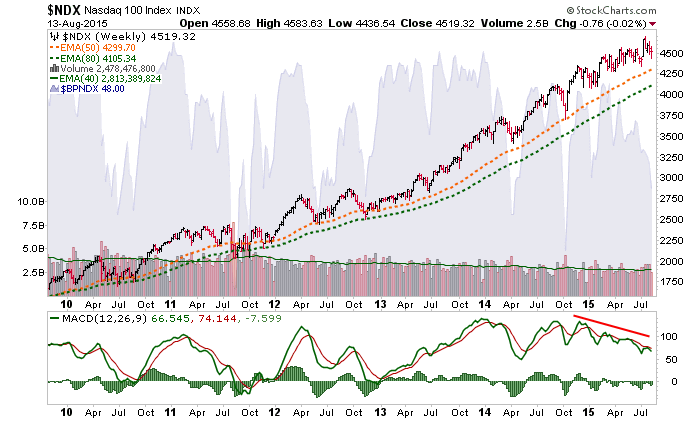
Nasdaq 100 has a bigger divergence, still. Price has continued up, as fewer big tech captains do the heavy lifting.

NASDAQ100 Weekly Chart

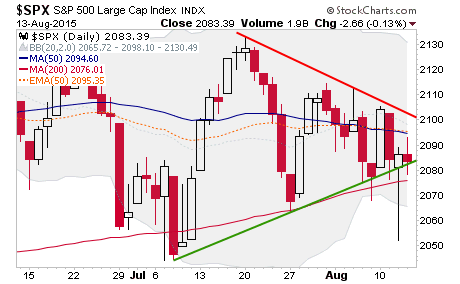
As noted above, price is the ultimate decider and price has not yet decided. Dialing in the view of SPX to a daily once more, we note an index getting pinched between the daily SMA's 50 and 200. Price direction, up or down, will be coming soon.

S&P500 Daily Chart

Subscribe to NFTRH Premium for your 25-35 page weekly report, interim updates (including Key ETF charts) and NFTRH+ chart and trade ideas or the free eLetter for an introduction to our work. Or simply keep up to date with plenty of public content at NFTRH.com and Biiwii.com.

By Gary Tanashian

http://biiwii.com

© 2015 Copyright  Gary Tanashian - All Rights Reserved

Disclaimer: The above is a matter of opinion provided for general information purposes only and is not intended as investment advice. Information and analysis above are derived from sources and utilising methods believed to be reliable, but we cannot accept responsibility for any losses you may incur as a result of this analysis. Individuals should consult with their personal financial advisors.

Gary Tanashian Archive

© 2005-2022 http://www.MarketOracle.co.uk - The Market Oracle is a FREE Daily Financial Markets Analysis & Forecasting online publication.


Post Comment

Only logged in users are allowed to post comments. Register/ Log in