Is This Stocks Bull Market Summit?
Stock-Markets / Stock Markets 2015 Aug 04, 2015 - 12:03 PM GMTBy: Puru_Saxena
 The primary uptrend in common stocks began in March 2009, so this bull-market is now over 6 years old. The bull-market on Wall Street was unleashed by the Federal Reserve's unprecedented QE program and it is not a coincidence that its momentum waned around the same time America's central bank stopped buying bonds.
You will recall that over the past several months, we repeatedly stated that the stock market's breadth was getting narrower and that not all sectors were participating in the festivities. Accordingly, we positioned our managed portfolios in the strongest areas and sectors of the market.
Unfortunately, for the stock market bulls, the technical picture has deteriorated further and it now appears as though Wall Street has commenced a topping out process. At the time of writing, the S&P500 Index is still trading above its last month's low but if it breaches that level, the die will be cast and common stocks will then be in a primary downtrend.
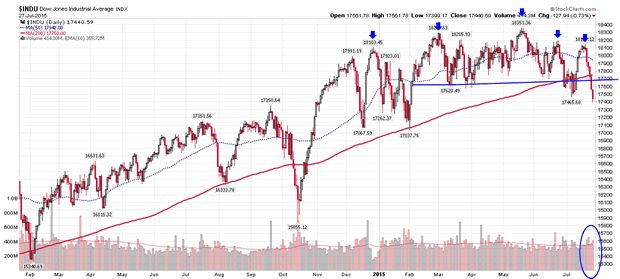
It is noteworthy that although the S&P500 Index, the NASDAQ Composite and Russell 2000 Growth Index are currently holding up, the Dow Jones Industrial Average and the Dow Jones Transportation Average have already sliced through the 200-day moving average. Furthermore, both these indices are now trading at multi-month lows and this does not bode well for the broad market.
If you review Figure 1, you will observe that the Dow Jones Industrial Average has been under distribution since late last year and it has now sliced through its multi-month support level. More importantly, the bellwether index has now fallen below its 200-day moving average (red line on the chart) and also gone through its early July low. Last but not least, you can see that since peaking in May, its subsequent two rally attempts have failed beneath the all-time high and the most recent decline has occurred on rising volume (blue circle on the chart).
Figure 1: Dow Jones Industrial Average (daily chart)

Source: www.stockcharts.com
The above are not healthy signs and when you consider that many sectors (energy, industrials, materials and utilities) have already rolled over badly; it is conceivable that we may now be in the early stages of a primary downtrend.
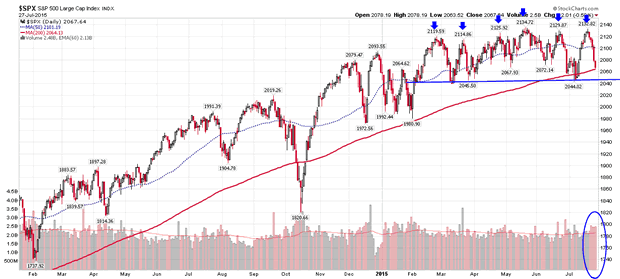
At this stage, we cannot guarantee whether the 6-year primary uptrend has already ended but if the bull market is still alive, the major US indices will soon need to rally to new highs on expanding volume. Furthermore, even if they manage to achieve this feat, both the S&P500 Index and the Dow Jones Industrial Average will need to confirm the upside breakout by staying above the May high for at least 5-6 trading sessions. Conversely, if the S&P500 Index breaks below its July low and breaches its 200-day moving average on expanding volume, it will confirm the end of the primary uptrend.
If you review Figure 2, you will note that the S&P500 peaked in May 2015 and since then, the rally attempts have failed beneath the all-time high. More importantly, volume has expanded on down days (blue circle on the chart) and this indicates heavy institutional selling. Up until now, the S&P500 Index has managed to stay above its early July-low and it is currently sitting on its 200-day moving average (red line on the chart). However, if these levels are breached, it will almost certainly signal the start of a primary downtrend in common stocks.
Figure 2: S&P500 Index (daily chart)

Source: www.stockcharts.com
In addition to the poor price and volume action, the market's breadth has also deteriorated and this suggests that the major US indices may be on the cusp of rolling over. Remember, during the past stock market cycles, the NYSE Advance/Decline always topped out before the bull-market top and it is bearish that this indicator peaked in April, meanwhile the S&P500 made a new high in May.
Adding to our 'worry list' is the fact that over the past several weeks, the number of new 52-week lows on the NYSE has spiked, whereas the number of new 52-week lows has shrunk. In other words, more and more stocks are now breaking down and only a handful of stocks are breaking out to new 52-week highs (not a healthy sign).
In the corporate world, over the past few days, many bellwether companies have either announced disappointing earnings or lowered their forward guidance and this indicates that perhaps we have already seen the high point of this business cycle.
Finally, it is ominous that despite the ECB's ongoing QE program, European stocks are not advancing. Instead, they are taking their cues from overseas and selling off on rising volume.
You will remember that the global financial crisis of 2008 started in the West and its repercussions were felt all over the world. This time around, we are wondering whether the epicentre of the quake will be in China and if the collapsing prices of commodities are forecasting trouble in the world's second largest economy?
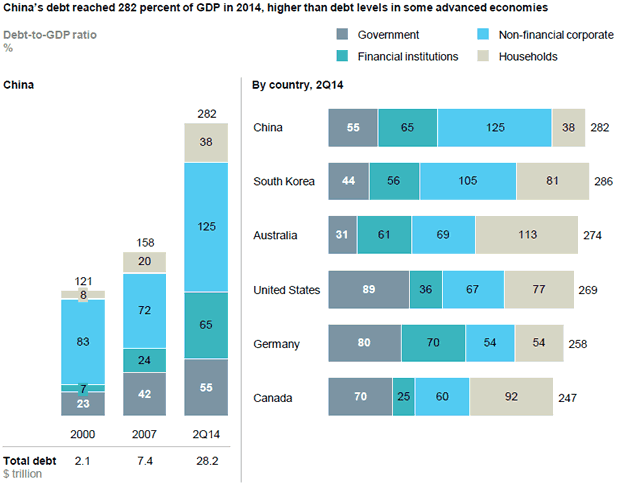
Whether you like it or not, China's economy is in on shaky ground and the nation's debt level is now extremely high. According to McKinsey & Company, China's total debt has quadrupled, rising from US$7 trillion in 2007 to US$28 trillion by mid-2014. Astonishingly, at 282% of GDP, China's debt as a share of GDP is larger than that of many developed economies (Figure 3)!
Figure 3: China's debt bomb!

Source: McKinsey & Company
According to some estimates, nearly half of the debt of Chinese households, corporations and governments is directly or indirectly related to real estate; collectively worth as much as US$9 trillion.
Given the high level of borrowing, it is no surprise that the Chinese property market has appreciated sharply since 2008 (60% in 40 Chinese cities and even more in Shanghai and Shenzhen). However, trees do not grow to the heavens and China's red hot real estate market is now showing signs of cooling off.
The good news is that the Chinese households are not overly leveraged so they should be able to withstand a big slide in property prices. Unfortunately, housing construction is an enormous sector in China, accounting for 15% of GDP. So, a slowdown in the property market will undoubtedly dampen business activity and a prolonged downturn will hurt thousands of small players in the industry, many of which will be unable to keep up with their debt service payments.
Another area of concern is China's shadow banking system whic h has now ballooned to US$6.5 trillion and accounts for half of new lending! It is notable that most of the loans within the shadow banking system are related to real-estate.
The main vehicles in shadow banking include trust accounts, which promise wealthy investors high returns; wealth management products marketed to retail customers (remember subprime and the AAA-rated securities?); entrusted loans made by companies to one another; and an array of financing companies, microcredit institutions and informal lenders.
It is noteworthy that both trust accounts and wealth management products are incorrectly marketed by banks, creating a false impression that they are guaranteed. The underwriting standards and risk management employed by the managers of these funds are also subpar.
In any event, the level of risk involved in China's shadow banking may well soon be tested by the ongoing slowdown in the property sector. Although anything can happen, we believe that the price deflation occurring in the commodities complex is forecasting a hard landing in China. Furthermore, China's stock market crash certainly does not bode well for Beijing's grand plan of transforming the nation into a consumer-led economy.
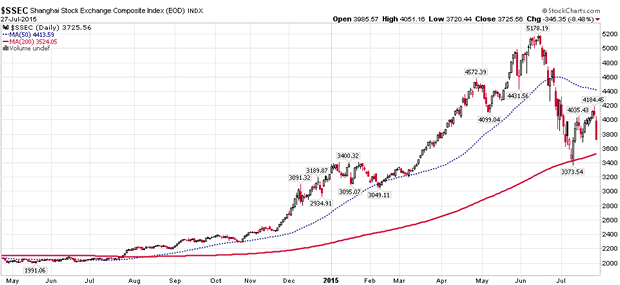
If you review Figure 4, you will note that the counter-trend rally in the Shanghai Composite Index has ended and another down leg is now underway. Although Beijing is desperately trying to prop up the stock market, given the high level of margin debt, it may struggle to prevent a true market clearance.
Figure 4: Shanghai Composite Index (daily chart)

Source: www.stockcharts.com
From our perspective, if the Shanghai Composite takes out its July low, it will be very bearish and further losses for the millions of retail investors will probably hurt China's consumer spending; thereby slowing down its economy even further.
In any event, we do not need to jump the gun; instead, we simply need to monitor the ongoing devastation in the commodities market, which (among others) must be hurting the economies of Australia, Brazil, Canada and Russia.
Turning back to the financial markets, it appears as though Wall Street is topping out and the path of least resistance may be changing to the downside. Given the signs of market distribution, we have recently reduced our exposure to equities by approximately 30% and started buying assets which should benefit from the stock market downtrend.
At present, since the S&P500 Index is still trading above its July-low and our primary trend filter is still in an uptrend, we have not entirely removed equities from our managed portfolios. However, our remaining positions are on an extremely tight leash and our trailing stops are only 6-7% away from the current prices. So, if the stock market deteriorates further, our trailing stops will be hit on our remaining positions and we will be totally out of harm's way.
More importantly, we have already identified additional assets which are likely to benefit from a contraction (US Treasuries, currency plays and inverse ETFs) and at the appropriate time, we will pull the trigger. Thus, if the stock market enters a multi-month bear market, not only will our clients' portfolios be protected from the carnage, they will probably appreciate in value.
Puru Saxena is the CEO of Puru Saxena Wealth Management, his Hong Kong based SFC regulated firm which offers discretionary portfolio management and research services to individual and corporate clients. The firm manages two trend-following strategies – Discretionary Equity Portfolio and Discretionary Fund portfolio. In addition, the firm also manages a Discretionary Blue-chip Portfolio which invests in high-dividend world leading companies. Performance data of these strategies is available from www.purusaxena.com
Puru Saxena also publishes Money Matters, a monthly economic report, which identifies trends and highlights investment opportunities in all major markets. In addition to the monthly report, subscribers of Money Matters also receive “Weekly Updates” covering the recent market action. Money Matters is available by subscription from www.purusaxena.com
Puru Saxena
Website – www.purusaxena.com
Puru Saxena is the founder of Puru Saxena Wealth Management, his Hong Kong based firm which manages investment portfolios for individuals and corporate clients. He is a highly showcased investment manager and a regular guest on CNN, BBC World, CNBC, Bloomberg, NDTV and various radio programs.
Copyright © 2005-2015 Puru Saxena Limited. All rights reserved.
Disclaimer: The above is a matter of opinion provided for general information purposes only and is not intended as investment advice. Information and analysis above are derived from sources and utilising methods believed to be reliable, but we cannot accept responsibility for any losses you may incur as a result of this analysis. Individuals should consult with their personal financial advisors.© 2005-2022 http://www.MarketOracle.co.uk - The Market Oracle is a FREE Daily Financial Markets Analysis & Forecasting online publication.


