


BSE Sensex Stocks Bear Market Underway
Stock-Markets / India Aug 02, 2015 - 05:12 PM GMTBy: Austin_Galt

 The Indian stock exchange, the BSE Sensex, looks to be tracing out its first steps in a new bear market so let's review the action using the monthly and weekly charts.
BSE Sensex Monthly Chart
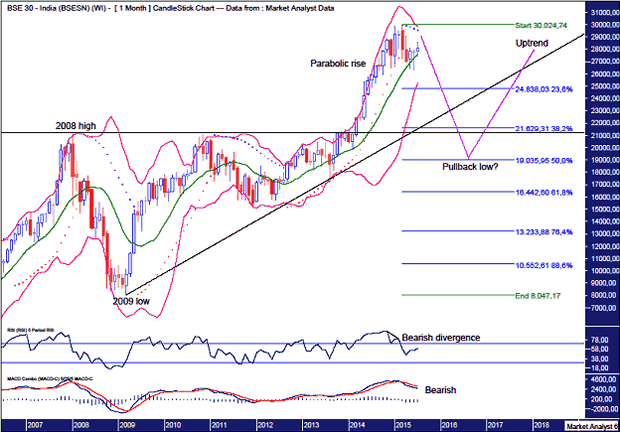
The move up into the all time high at 30024 was a parabolic rise which is so often found at the end of bull trends.
The all time high was accompanied by a bearish divergence in the RSI despite the parabolic rise.
The MACD indicator made a bearish crossover in the month of the high and is now trending down and looking bearish.
The Bollinger Bands show price is currently finding support at the middle band and while I think price can slide a touch higher with this band I expect this support to shortly give way as price breaks down to the lower band and beyond.
The PSAR indicator has a bearish bias with the dots above price. These dots will be just above 29400 during August and I expect price to give this resistance a good test.
It is my belief that a bear market is now underway so where do I expect this bear market to end?
The horizontal line denotes the 2008 high at 21206 and I expect price to dip below this level as it gives this support a thorough workout.
I have drawn an uptrend line from the 2009 low which is a very obvious support level - so obvious that I expect price to crack below there in a kind of fake out move.
I have added Fibonacci retracement levels of the move up from 2009 low to all time high and the level that has most appeal to me currently is the 50% level which stands at 19035. Price correcting to that level would mean a solid correction of around 35%. The 61.8% level at 16442 also has to be kept in mind.
Once that low is in place I expect the overall uptrend to continue which sees price trade to new all time higher.
Let's now look in a bit closer using the weekly chart.
BSE Sensex Weekly Chart
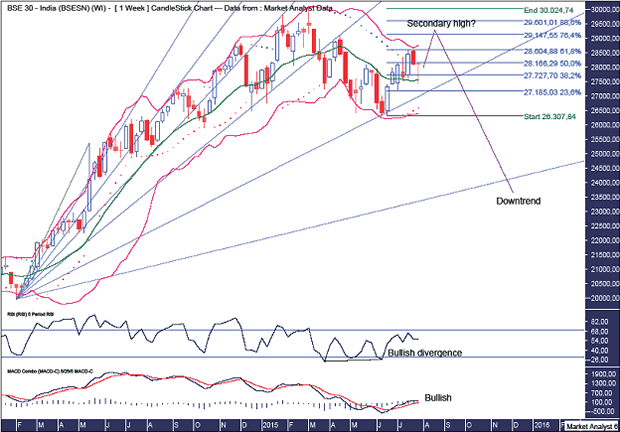
The recent low showed a bullish divergence on the RSI while the MACD indicator has a bullish bias so all looks good for a solid move into secondary high.
The PSAR indicator has a bullish bias with the dots below price so no problems there.
The Bollinger Bands show price is back to the upper band and I expect one last surge higher as it clings to this band and puts in a secondary high.
I have added Fibonacci retracement levels of the move down from high and the first rally in a new bear trend often makes a deep retracement so the level I am favouring for secondary high is the 76.4% level which stands at 29147. Let's see.
I have drawn a Fibonacci Fan which continues to show some nice symmetry with price. We can see price finding support and resistance and all the angles as it drove into high and then started to decline. The recent low was at support from the 76.4% angle and once the secondary high is in place price should fall and crack below this support angle.
Summing up, a big bear market now looks in play while we just await the major secondary high which looks set to occur imminently.
By Austin Galt
Austin Galt is The Voodoo Analyst. I have studied charts for over 20 years and am currently a private trader. Several years ago I worked as a licensed advisor with a well known Australian stock broker. While there was an abundance of fundamental analysts, there seemed to be a dearth of technical analysts. My aim here is to provide my view of technical analysis that is both intriguing and misunderstood by many. I like to refer to it as the black magic of stock market analysis.
Email - info@thevoodooanalyst.com
© 2015 Copyright The Voodoo Analyst - All Rights Reserved
Disclaimer: The above is a matter of opinion provided for general information purposes only and is not intended as investment advice. Information and analysis above are derived from sources and utilising methods believed to be reliable, but we cannot accept responsibility for any losses you may incur as a result of this analysis. Individuals should consult with their personal financial advisors.
Austin Galt Archive |
© 2005-2022 http://www.MarketOracle.co.uk - The Market Oracle is a FREE Daily Financial Markets Analysis & Forecasting online publication.