Most Popular
1. It’s a New Macro, the Gold Market Knows It, But Dead Men Walking Do Not (yet)- Gary_Tanashian
2.Stock Market Presidential Election Cycle Seasonal Trend Analysis - Nadeem_Walayat
3. Bitcoin S&P Pattern - Nadeem_Walayat
4.Nvidia Blow Off Top - Flying High like the Phoenix too Close to the Sun - Nadeem_Walayat
4.U.S. financial market’s “Weimar phase” impact to your fiat and digital assets - Raymond_Matison
5. How to Profit from the Global Warming ClImate Change Mega Death Trend - Part1 - Nadeem_Walayat
7.Bitcoin Gravy Train Trend Forecast 2024 - - Nadeem_Walayat
8.The Bond Trade and Interest Rates - Nadeem_Walayat
9.It’s Easy to Scream Stocks Bubble! - Stephen_McBride
10.Fed’s Next Intertest Rate Move might not align with popular consensus - Richard_Mills
Last 7 days
S&P Stock Market Detailed Trend Forecast Into End 2024 - 25th Apr 24
US Presidential Election Year Equity Performance in the Presence of an Inverted Yield Curve- 25th Apr 24
Stock Market "Bullish Buzz" Reaches Highest Level in 53 Years - 25th Apr 24
Managing Your Public Image When Accused Of Allegations - 25th Apr 24
Friday Stock Market CRASH Following Israel Attack on Iranian Nuclear Facilities - 19th Apr 24
All Measures to Combat Global Warming Are Smoke and Mirrors! - 18th Apr 24
Cisco Then vs. Nvidia Now - 18th Apr 24
Is the Biden Administration Trying To Destroy the Dollar? - 18th Apr 24
S&P Stock Market Trend Forecast to Dec 2024 - 16th Apr 24
No Deposit Bonuses: Boost Your Finances - 16th Apr 24
Global Warming ClImate Change Mega Death Trend - 8th Apr 24
Gold Is Rallying Again, But Silver Could Get REALLY Interesting - 8th Apr 24
Media Elite Belittle Inflation Struggles of Ordinary Americans - 8th Apr 24
Profit from the Roaring AI 2020's Tech Stocks Economic Boom - 8th Apr 24
Stock Market Election Year Five Nights at Freddy's - 7th Apr 24
It’s a New Macro, the Gold Market Knows It, But Dead Men Walking Do Not (yet)- 7th Apr 24
AI Revolution and NVDA: Why Tough Going May Be Ahead - 7th Apr 24
Hidden cost of US homeownership just saw its biggest spike in 5 years - 7th Apr 24
What Happens To Gold Price If The Fed Doesn’t Cut Rates? - 7th Apr 24
The Fed is becoming increasingly divided on interest rates - 7th Apr 24
The Evils of Paper Money Have no End - 7th Apr 24
Stock Market Presidential Election Cycle Seasonal Trend Analysis - 3rd Apr 24
Stock Market Presidential Election Cycle Seasonal Trend - 2nd Apr 24
Dow Stock Market Annual Percent Change Analysis 2024 - 2nd Apr 24
Bitcoin S&P Pattern - 31st Mar 24
S&P Stock Market Correlating Seasonal Swings - 31st Mar 24
S&P SEASONAL ANALYSIS - 31st Mar 24
Here's a Dirty Little Secret: Federal Reserve Monetary Policy Is Still Loose - 31st Mar 24
Tandem Chairman Paul Pester on Fintech, AI, and the Future of Banking in the UK - 31st Mar 24
Stock Market Volatility (VIX) - 25th Mar 24
Stock Market Investor Sentiment - 25th Mar 24
The Federal Reserve Didn't Do Anything But It Had Plenty to Say - 25th Mar 24

Market Oracle FREE Newsletter

How to Protect your Wealth by Investing in AI Tech Stocks

8 Unprecedented Extremes Indicate a Stock Market Bubble in Trouble

Stock-Markets / Stock Markets 2015 Jul 17, 2015 - 02:40 PM GMT

By: EWI

Stock-Markets

This article was adapted from Robert Prechter's June 2015 Elliott Wave Theorist. For more charts and detailed commentary, analysis and forecasts from Prechter's latest issues, click here for the extended subscriber version of this report -- it's free.

It is amazing to read assertions from the Fed and others that the stock market is nowhere near being in a bubble. Several aspects of the financial environment are actually so extreme as to be unprecedented. Some indicate a bubble, and others a bubble in trouble.


Below are eight indicators we are watching closely, among others.

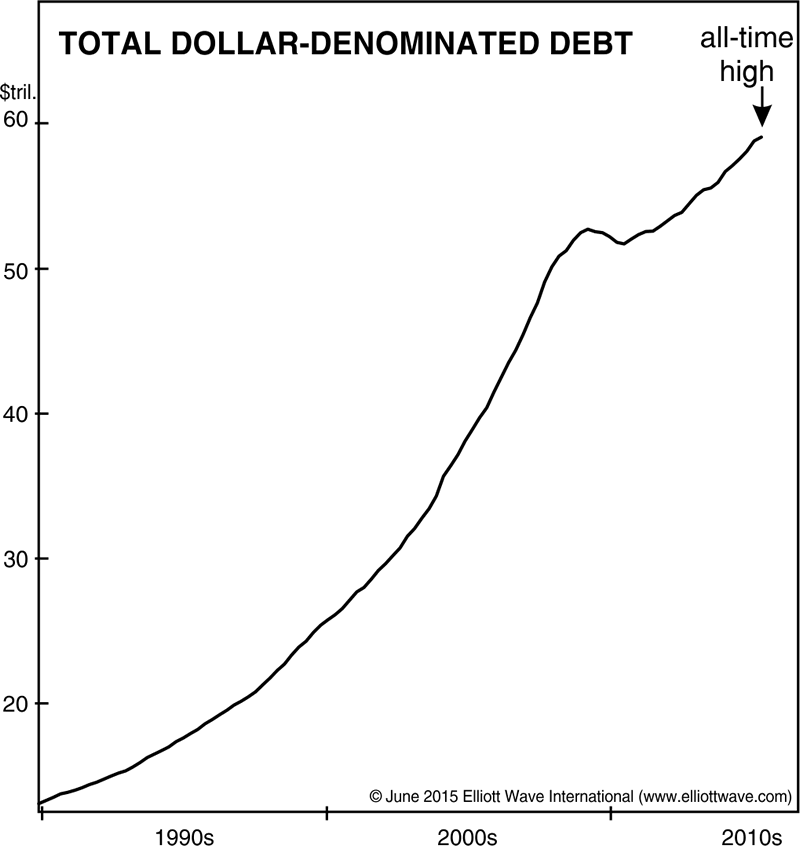
1) Record debt in U.S. dollars

Total dollar-denominated debt peaked at $52.7 trillion in early 2009. At the end of Q1 2015, it stands at $59 trillion, an unprecedented amount.

2) Margin Debt at All-Time Highs

Never have more trading-account owners owed so much money, and never have they had such a low level of available funds from which further to draw.

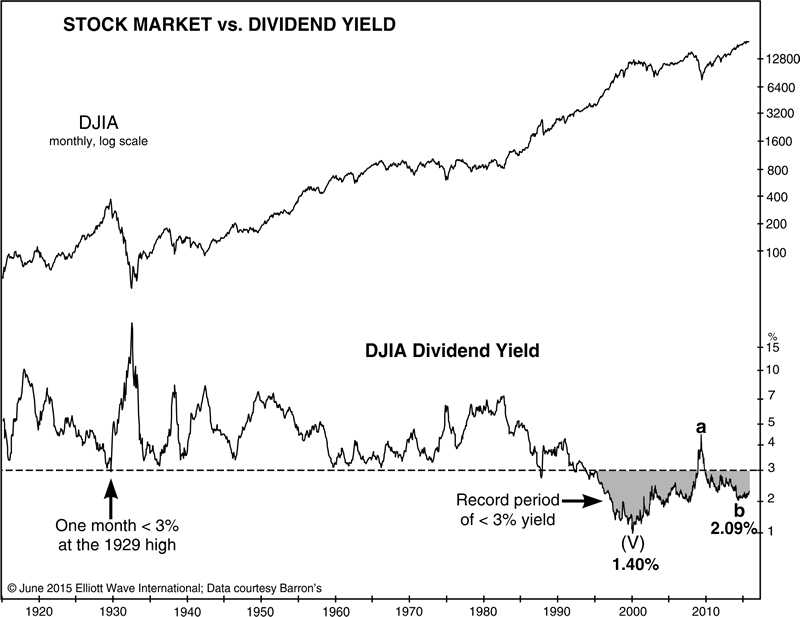
3) Stocks Are Overvalued (based on dividend yields)

The Dow's annual dividend payout has been less than 3% for 235 out of the past 246 months. Prior to the bull market that started in 1982, the longest duration under 3% was just one month, at the top in 1929.

4) Fund Managers Are Maxed Out

The percentage of cash in mutual funds has been below 4% for all but one of the past 70 months (a period of nearly six years). Prior to this time, the longest such duration was only nine months, a streak that ended in October 2007.

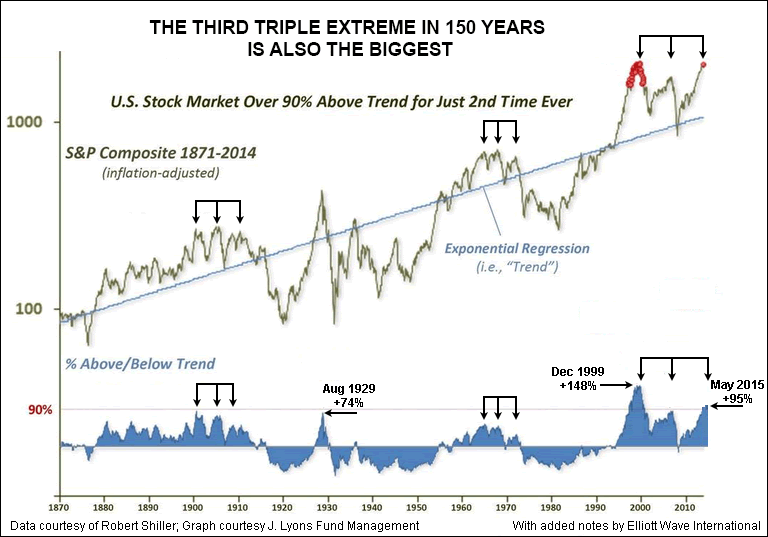
5) Stocks are at a Triple Extreme

Previous triple manias occurred in 1901/1906/1909 and 1965/1968/1972, and both led to severe bear markets. This one is even bigger and has lasted longer.

6) Stocks Rose on Low Volume for Six Straight Years

Such a thing has never occurred before -- one year, maybe, but not six.

7) Unprecedented Divergence Among Major Indexes

On May 20, we published an interim issue of The Elliott Wave Theorist to tell subscribers:

Today something amazing happened: The Dow Transports closed at a 6-month low on the same day that the S&P 500 made an all-time intraday high. I doubt this has ever happened before.

The Dow Theory non-confirmation between the Dow Industrials and Transports is now [more than] six months old. This big a divergence, for this long a time, is very bearish.

8) Advisor Bearishness at 38-Year Low (optimism near record high)

The 30-week moving average of the percentage of bears among stock market advisors is at a 38-year low. (Investors Intelligence data is inverted to show optimism.)

This article was adapted from Robert Prechter's June 2015 Elliott Wave Theorist. For more charts and detailed commentary, analysis and forecasts from Prechter's latest issues, click here for the extended subscriber version of this report -- it's free.


About the Publisher, Elliott Wave International
Founded in 1979 by Robert R. Prechter Jr., Elliott Wave International (EWI) is the world's largest market forecasting firm. Its staff of full-time analysts provides 24-hour-a-day market analysis to institutional and private investors around the world.


© 2005-2022 http://www.MarketOracle.co.uk - The Market Oracle is a FREE Daily Financial Markets Analysis & Forecasting online publication.


Comments

HarrisD
19 Jul 15, 00:52
US Stock Market Bubble

Dear Author,

Currently, the US Stock market indexes are NOT in a bubble. The indexes are certainly very extended, however, they are far from exhibiting the extremely over extended characteristics that are found with an actual stock market bubble. In this case I agree with the FED.

Currently, around the world there are three equity market bubbles fully inflated. These are Argentina, Venezuela and China. A number of other markets are partially inflated but are not yet full-blown bubbles. In this respect, the US markets are far from being in a bubble state and therefore will weather the coming storm better than most other markets around the world. The FED ended EQ3 well before a bubble was forming in the US, which is good news.

In terms of individual stocks in the US, there are a number of key stocks that are themselves in a bubble and will deflate over the coming 12 to 24 months. To name a few here I state Apple (APPL), Google (GOOGL), Home Depot (HD), Netflix (NFLX) and Boeing (BA). There are other US stocks, but these will do for now. The fact that there is a limited number (mostly momentum stocks) is one reason why the US indexes have not yet entered bubble territory. I had an article published by Market Oracle in February 2015 on Apple Inc.

Over the last few years I have developed a mathematical model that is designed to identify and classify stock market bubbles and it is the output data from this model that has helped me understand the current status of equity markets around the globe. The model works equally well with commodities. I have gone back over the last 100 years and analyzed 20 different bubbles, covering US markets in 1929 (DOW), 1987 (DOW) and 2000 (NASDAQ), the Japan market in 1990 (NI225), China, Brazil, India and Russia, and also Oil (2008), Gold and Solver (2011). Twenty distinct bubbles in all.

We are fast approaching a significant stock market top in the US markets (which may well complete before the end of August) and then we could see a significant downturn both here and abroad. Additional models I have developed indicate a drop in the DOW of between 12% and 33%, perhaps more, but this will be a major correction NOT a crash. Expect to see the low in the DOW sometime in 2016, but certainly before mid-2017.

We have reached a point in time where stock market prices are at historic highs and commodity prices are at or near historic lows. This is set to reverse soon !

Cheers,

David


Post Comment

Only logged in users are allowed to post comments. Register/ Log in