Most Popular
1. It’s a New Macro, the Gold Market Knows It, But Dead Men Walking Do Not (yet)- Gary_Tanashian
2.Stock Market Presidential Election Cycle Seasonal Trend Analysis - Nadeem_Walayat
3. Bitcoin S&P Pattern - Nadeem_Walayat
4.Nvidia Blow Off Top - Flying High like the Phoenix too Close to the Sun - Nadeem_Walayat
4.U.S. financial market’s “Weimar phase” impact to your fiat and digital assets - Raymond_Matison
5. How to Profit from the Global Warming ClImate Change Mega Death Trend - Part1 - Nadeem_Walayat
7.Bitcoin Gravy Train Trend Forecast 2024 - - Nadeem_Walayat
8.The Bond Trade and Interest Rates - Nadeem_Walayat
9.It’s Easy to Scream Stocks Bubble! - Stephen_McBride
10.Fed’s Next Intertest Rate Move might not align with popular consensus - Richard_Mills
Last 7 days
US Bond Market Panic Continues Towards May Expected Japanese Rate Hike Volatility Spike - 24th April 25
Stock Market Tarrified as President Dump Risks Turning Recession into Stagflationary Depression - 21st April 25
President Dump Delivers BEAR MARKET - Stock Market Battles Between Order and Chaos - 7th April 25
Stocks Bull Market End Game Bear Start Strategy - 20th Mar 25
Gold and System Collapse: Charting the Bank Run of the Mighty US Dollar - 20th Mar 25
Tesla's Troubles — Is it Musk or is it More? - 20th Mar 25
The Stock Market Bear / Crash indicator Window - 9th Mar 25
Big US Tech Stocks Fundamentals - 9th Mar 25
No Winners When The Inflation Balloon Pops - 9th Mar 25

Market Oracle FREE Newsletter

How to Protect your Wealth by Investing in AI Tech Stocks

Dow INDU Stocks Index Update

Stock-Markets / Stock Markets 2015 Jul 07, 2015 - 11:54 AM GMT

By: Rambus_Chartology

Stock-Markets

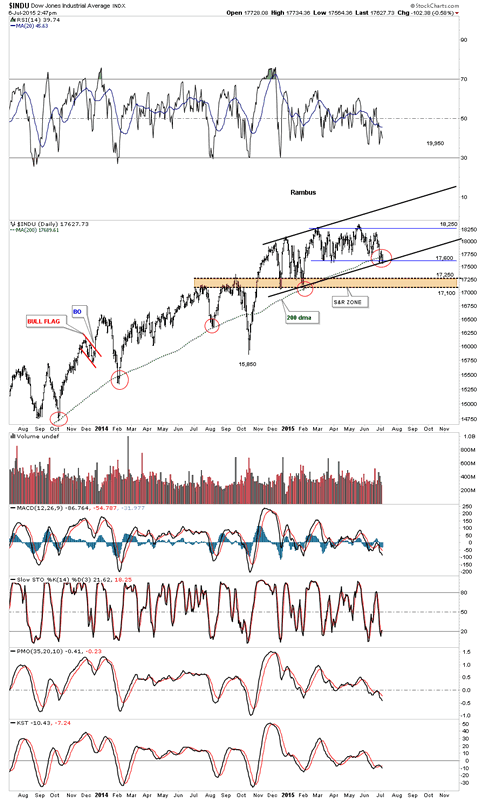
We are getting a test of the low from the big decline last Monday which is to be expected as many times it takes multiple tests before support really sticks. This is now the moment of truth as this low needs to hold support or a bigger decline can be expected. There is the 200 dma, the time cycle low and the very high volume spike from last Monday, in the down to up volume chart, that are showing this could be an important low.


Dow Industrials Daily Chart 1


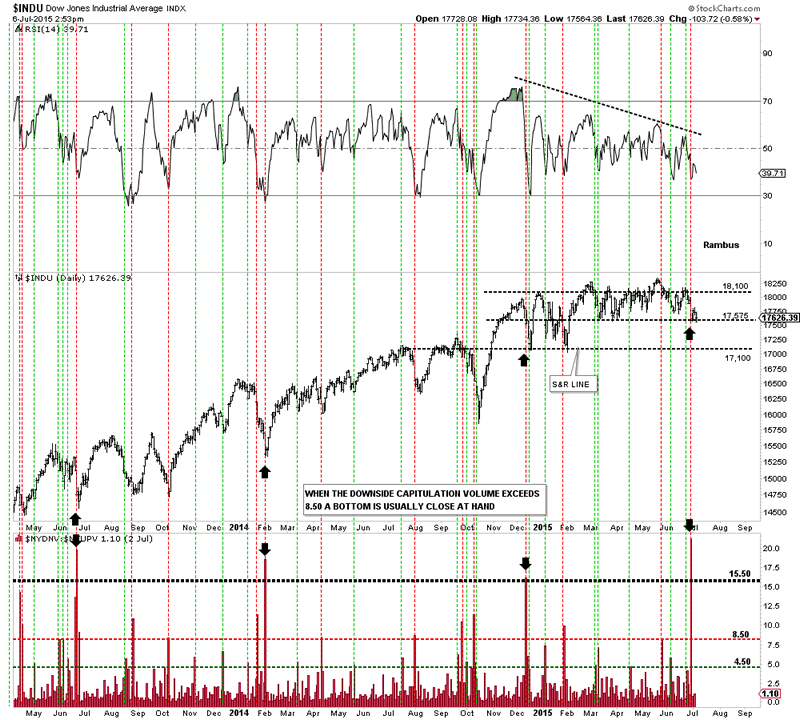
The down to up volume chart shows the low from last Monday had a very large capitulation spike that was the highest since 2012 or so.

All the best

Gary (for Rambus Chartology)

http://rambus1.com

FREE TRIAL - http://rambus1.com/?page_id=10

© 2015 Copyright Rambus- All Rights Reserved

Disclaimer: The above is a matter of opinion provided for general information purposes only and is not intended as investment advice. Information and analysis above are derived from sources and utilising methods believed to be reliable, but we cannot accept responsibility for any losses you may incur as a result of this analysis. Individuals should consult with their personal financial advisors.

Rambus Chartology Archive

© 2005-2022 http://www.MarketOracle.co.uk - The Market Oracle is a FREE Daily Financial Markets Analysis & Forecasting online publication.


Post Comment

Only logged in users are allowed to post comments. Register/ Log in