Stock Market, Investing Big Picture
Stock-Markets / Stock Markets 2015 Jul 06, 2015 - 03:38 PM GMTBy: Peter_Schiff
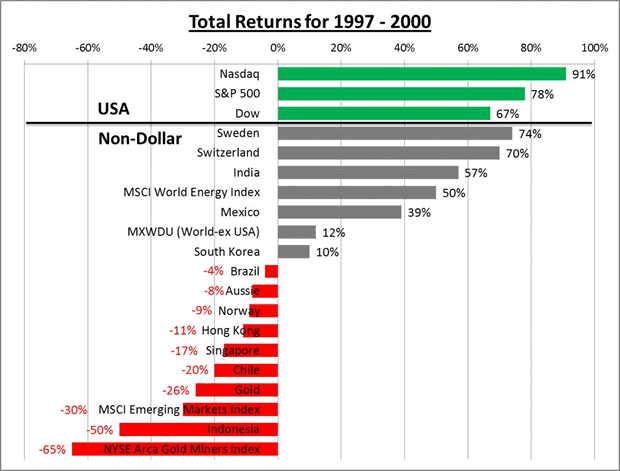
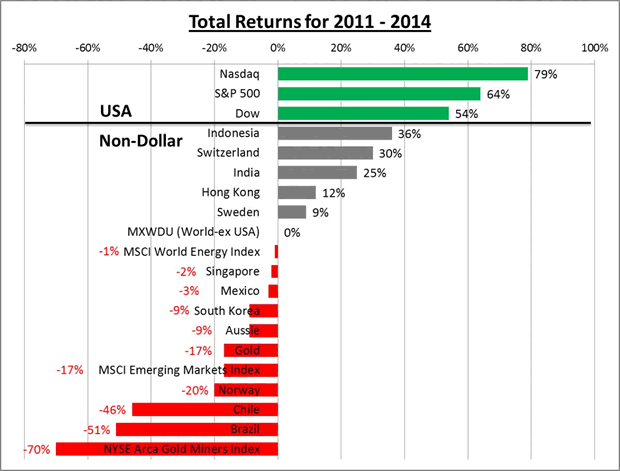
 The past four years or so have been extremely frustrating for investors like me who have structured their portfolios around the belief that the current experiments in central bank stimulus, the anti-business drift in Washington, and America's mediocre economy and unresolved debt issues would push down the value of the dollar, push up commodity prices, and favor assets in economies with relatively low debt levels and higher GDP growth. But since the beginning of 2011, the Dow Jones Industrial Average has rallied 67% while the rest of the world has been largely stuck in the mud. This dominance is reminiscent of the four years from the end of 1996 to the end of 2000, when the Dow rallied 54% while overseas markets languished. Although past performance is no guarantee of future results, a casual look back at how the U.S. out-performance trend played out the last time it had occurred should give investors much to think about.
The late 1990s was the original "Goldilocks" era of U.S. economic history, one in which all the inputs seemed to offer investors the best of all possible worlds. The Clinton Administration and the first Republican-controlled Congress in a generation had implemented policies that lowered taxes, eased business conditions, and encouraged business investment. But, more importantly, the Federal Reserve was led by Alan Greenspan, whose efforts to orchestrate smooth sailing on Wall Street led many to dub Mr. Greenspan "The Maestro."
Towards the end of the 1990's, Greenspan worked hard to insulate the markets from some of the more negative developments in global finance. These included the Asian Debt Crisis of 1997 and the Russian debt default of 1998. But the most telling policy move of the Greenspan Fed in the late 1990's was its response to the rapid demise of hedge fund Long term Capital Management (LTCM), whose strategy of heavily leveraged arbitrage backfired spectacularly in 1998. Greenspan engineered a $3.6 billion bailout and forced sale of LTCM to a consortium of Wall Street firms. The intervention was an enormous relief to LTCM shareholders but, more importantly, it provided a precedent that the Fed had Wall Street's back.
Not surprisingly, the 1990s became one of the longest sustained bull markets on record. But in the latter part of the decade the markets really started to climb in an unprecedented trajectory. As the bubble began inflating in earnest Greenspan was reluctant to follow the dictum that the Fed's job was to remove the punch bowl before the party got out of hand. Instead he argued that the Fed shouldn't prevent bubbles from forming, but simply to clean up the mess after they burst.
But while U.S. markets were taking off, the rest of the world was languishing, or worse:

Created by EPC using data from Bloomberg
All returns are currency-adjusted
But then a very funny thing happened. In March 2000, the music stopped and the dotcom bubble finally burst, sending the Nasdaq down nearly 50% by the end of the year, and a staggering 70% by September 2001. When investors got back into the market their values had changed. They now favored low valuations, real revenue growth, understandable business models, high dividends, and low debt. They came to find those features in the non-dollar investments that they had been avoiding.
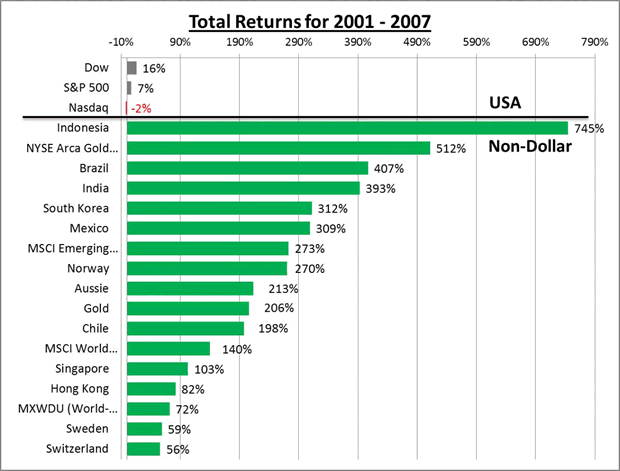
Over the seven years that began at the end of 2000 and lasted until the end of 2007 the S&P 500 inched upwards by just 11%, for an average annual return of only 1.6%. But over that time frame the world index (which includes everything except the U.S.) was up 72%. The emerging markets, which had suffered the most during the four prior years, were up a staggering 273%. See table below:

Created by EPC using data from Bloomberg
All returns are currency-adjusted
Not surprisingly, the markets and asset classes that had been decimated by the Asian debt and currency crises, delivered stunning results. South Korea, which was only up 10% in the four years prior, was up 312% from 2001-2007. Brazil, which had fallen by 4%, notched a 407% return, and Indonesia, which had fallen by 50%, skyrocketed by 745%.
The period was also a great time for gold and gold stocks. The earlier four years had offered nothing but misery for investors like me who had been convinced that the Greenspan policies would undermine the dollar, shake confidence in fiat currency, and drive investors into gold. Instead, gold fell 26% (to a 20-year low), and shares of gold mining companies fell a stunning 65%.
But when the gold market turned in 2001, it turned hard. From 2001 - 2007, the dollar retreated by nearly 18% (FRED, FRB St. Louis), while gold shot up by 206%, and shares of gold miners surged 512%. As it turned out, we weren't wrong about the impact of the Fed's easy money, just too early.
2010 - 2014
In recent years, investors who have looked to avoid the dollar and the high-debt developed economies have encountered many of the same frustrations that they encountered in the late 1990s. Foreign markets, energy, commodities and gold have gone nowhere while the dollar and U.S. markets have surged as they did in 1997-2000.

Created by EPC using data from Bloomberg
All returns are currency-adjusted
It is said history may not repeat, but it often rhymes. If so, there may be a financial sonnet brewing. There are reasons to believe that relative returns globally will turn around now much as they did back in 2000. Perhaps even more decisively.
Just as they had back in the late 1990's, investors appear to be ignoring flashing red flags. In its Business and Finance Outlook 2015, the Organization for Economic Cooperation and Development (OECD), a body that could not be characterized as a harbinger of doom, highlighted some of the issues that should be concerning the markets. Reuters provides this summary of the report's conclusions:
- Encouraged by years of central bank easing, investors are plowing too much cash into unproductive and increasingly speculative investments while shunning businesses building economic growth.
- There is a growing divergence between investors rushing into ever riskier assets while companies remain too risk-averse to make investments.
- Investors are rewarding corporate managers focused on share-buybacks, dividends, mergers and acquisitions rather than those CEOS betting on long-term investment in research and development.
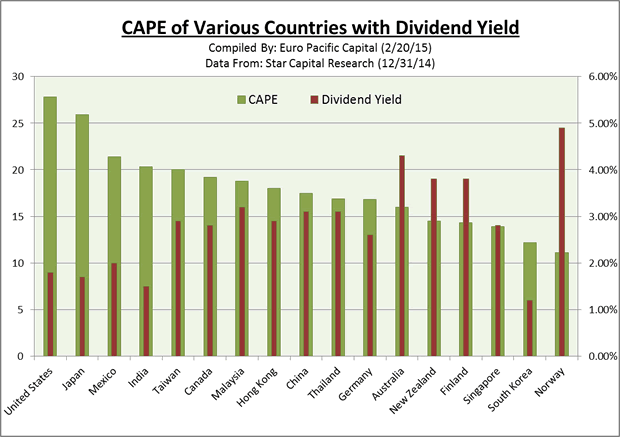
While these trends have been occurring around the world, they have become most pronounced in the U.S., making valuations disproportionately high relative to other markets. As we mentioned in a prior newsletter, looking at current valuations through a long term lens provides needed perspective. One of the best ways to do that is with the Cyclically-Adjusted-Price-to-Earnings (CAPE) ratio, which is also known as the Shiller Ratio (named after its developer, the Nobel prize-winning economist Robert Shiller).Using 2014 year-end CAPE ratios that average earnings over a trailing 10-year period, the global valuation imbalances become evident:

As of the end of 2014, the S&P 500 had a CAPE ratio of well over 27, at least 75% higher than the MSCI World Index of around 15. (High valuations are also on evidence in Japan, where similar monetary stimulus programs are underway). On a country by country basis, the U.S. has a CAPE that is at least 40% higher than Canada, 58% higher than Germany, 68% higher than Australia, 90% higher than New Zealand, Finland and Singapore, and well over 100% higher than South Korea and Norway. Yet these markets, despite the strong domestic economic fundamentals that we feel exist, are rarely mentioned as priority investment targets by the mainstream asset management firms.
In addition, U.S. stocks currently offer some of the lowest dividend yields to compensate investors for the higher valuations (see chart above). The current estimated 1.87% annual dividend yield for the S&P 500 is far below the current annual dividend yields of Australia, New Zealand, Finland and Norway.
If a dramatic shock occurs as it did in 2000, will investors again turn away from high leverage and high valuations to seek more modestly valued investments? Then, as now, we believe those types of assets can more readily be found in non-dollar markets.
Another similarity between then and now is the propensity to confuse an asset bubble for genuine economic growth. The dotcom craze of the 1990s painted a false picture of prosperity that was doomed to end badly once market forces corrected for the mal-investments. When that did occur, and stock prices fell sharply, the Fed responded by blowing up an even bigger bubble in real estate. When that larger bubble burst in 2008, the result was not just recession, but the largest financial crisis since the Great Depression.
But once again investors have mistaken a bubble for a recovery, only this time the bubble is much larger and the "recovery" much smaller. The middling 2% GDP growth we are currently experiencing is approximately half of what we saw in the late 1990s. In reality, the Fed has prevented market forces from solving acute structural problems while producing the mother of all bubbles in stocks, bonds, and real estate. A return to monetary normalcy is impossible without pricking those bubbles. Soon the markets will be faced with the unpleasant reality that the U.S. economy may now be so addicted to monetary heroine that another round of quantitative easing will be necessary to keep the bubble from deflating.
The current rally in U.S. stocks has gone on for nearly four full years without a 10% correction. Given that high asset prices are one of the pillars that support this weak economy, it is likely that the Fed will unleash another round of QE as soon as the market starts to fall in earnest. The realization that the markets are dependent on Fed life support should seal the dollar's fate. Once the dollar turns, a process that in my opinion began in April of this year, so too should the fortunes of U.S. markets relative to foreign markets. If I am right, we may be about to embark on what could become the single most substantial period of out-performance of foreign verses domestic markets.
While the party in the 1990s ended badly, the festivities currently underway may end in outright disaster. The party-goers may not just awaken with hangovers, but with missing teeth, no memories, and Mike Tyson's tiger in their hotel room.
This is a shortened version of the latest Euro Pacific Capital's Global Investor Newsletter.
Best Selling author Peter Schiff is the CEO and Chief Global Strategist of Euro Pacific Capital. His podcasts are available on The Peter Schiff Channel on Youtube
Catch Peter's latest thoughts on the U.S. and International markets in the Euro Pacific Capital Spring 2014 Global Investor Newsletter!
Regards,
Peter Schiff
Euro Pacific Capital
http://www.europac.net/
Peter Schiff Archive |
© 2005-2022 http://www.MarketOracle.co.uk - The Market Oracle is a FREE Daily Financial Markets Analysis & Forecasting online publication.


