China Stocks - This Is What a Bubble Looks Like
Stock-Markets / China Stocks Jun 30, 2015 - 06:19 PM GMTBy: Investment_U
 Matthew Carr writes: We just experienced another “Black Friday”...
Not in the U.S. markets, but across the Pacific in China.
You want to talk about overvalued? Overheated? The Chinese stock markets were on a tear earlier this year. The Shanghai Composite was up more than 100% at the start of June... and most of that was accomplished between the end of March and the beginning of June.
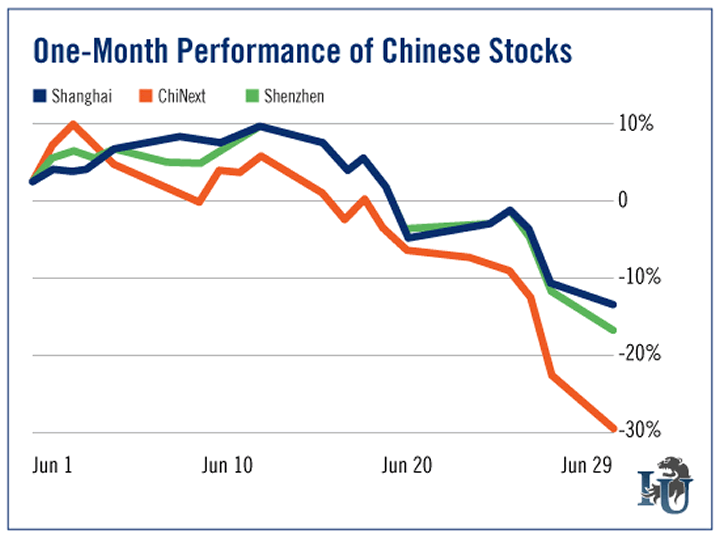
But over the past month, everything started to unravel. It all culminated in Friday’s epic collapse.

The Shanghai Composite tumbled 7.4%... the Shenzhen fell 7.9%... and the ChiNext tumbled 8.9%.
Then on Monday, as the situation in Greece came to a boil, Chinese stocks were hit again...
The Shanghai Composite shed another 3.3%. And that was after it wavered between a 7.6% plunge and a gain of 2.5%. It was a chaotic intraday move not seen in more than two decades.
The bull market in China is officially dead.
Analysts want to point at Greece as the cause of the enormous pullback. But that’s not really the case...
The real culprit here is margin selling.
A Debt Bubble for the Ages
An unprecedented amount of money was borrowed by traders and investors during the Chinese stock boom. You see, in bull markets, trading on margin adds to gains. It can turbocharge them, especially in a market that’s doubled in just a few months.
Think about these numbers...
Despite the fact that many Chinese indexes are down 20% or more in the month of June, the Shanghai Composite is still up nearly 100% for the year. The Shenzhen is still up 114%.
iuox.display(71);
So a lot of folks who took on debt were rewarded with huge short-term gains.
Then attitudes about Chinese stocks shifted. Leveraged traders liquidated margin positions for nearly a week straight, adding to the selling pressure.
It was inevitable. Because while margin purchases push stock prices higher, they will eventually create a violent move lower when positions are sold.
The downturn accelerates, picking up speed as losses mount. And, as a result, the Shanghai is now experiencing its longest stretch of declines in over a year.
In fact, the outlook for Chinese markets and stocks is decidedly negative all the way into 2016. Some institutions are calling for an additional 30% decline.
The question is... can it happen here?
Steady as She Goes
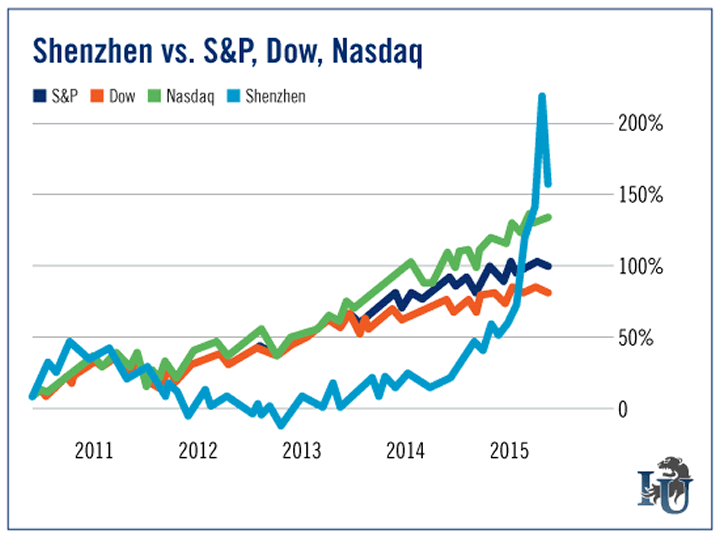
First off, the U.S. markets haven’t even come close to the performance of their Chinese counterparts over the past year.
And over the past five years, they’ve been much more in line with that Raconteurs song “Steady as She Goes.”

Sure, the broader U.S. markets have more than doubled from their lows in 2009. But they haven’t had any irrational breakouts or done anything too whacky.
On the other end of the spectrum, the Shenzhen underperformed the U.S. markets from 2012 through 2014. And then it skyrocketed, not only leaving the best-performing U.S. index in the dust this year but outperforming the five-year performance of all U.S. markets.
That’s what a bubble forming looks like. And what we’re seeing now? That’s what a bubble bursting looks like.
As for margin debt, this is a fear that’s been brewing in the U.S. markets for quite some time.
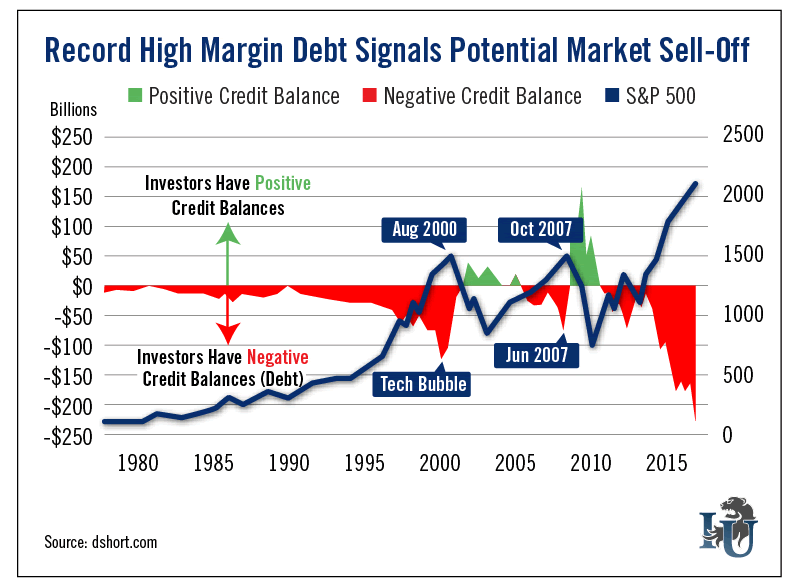
My colleague Ryan Fitzwater covered this in Investment U a couple of weeks ago, highlighting the dangers of investor margin debt. (Click here to check that out.)

What we can see from the chart Ryan created is that when the markets collapse, investors’ tactics change practically overnight.
In bear markets, investors are credit balance positive. They don’t take on debt and largely sit on cash.
But in bull markets, they’re willing to bet the farm until the bubble bursts. As we’re seeing in China, the resulting pullback can be sharp, swift and devastating.
Concerns have been growing here because U.S. margin debt hit a record high in April. It’s now higher than the levels in 2000 and 2007. By a lot. So when the selling starts - and I can’t predict when that will happen - this will play a major role in the downside pressure.
Just as we can’t prevent our neighbors from overleveraging themselves in their mortgage, though, we can’t prevent our fellow investors from doing the same with margin.
What we can do is protect ourselves the best we can, using protective stops and trailing stops. We can enjoy the ride higher while we can... all the while preparing ourselves to attack the lows when they appear.
Good investing,
Matthew
Copyright © 1999 - 2015 by The Oxford Club, L.L.C All Rights Reserved. Protected by copyright laws of the United States and international treaties. Any reproduction, copying, or redistribution (electronic or otherwise, including on the world wide web), of content from this website, in whole or in part, is strictly prohibited without the express written permission of Investment U, Attn: Member Services , 105 West Monument Street, Baltimore, MD 21201 Email: CustomerService@InvestmentU.com
Disclaimer: Investment U Disclaimer: Nothing published by Investment U should be considered personalized investment advice. Although our employees may answer your general customer service questions, they are not licensed under securities laws to address your particular investment situation. No communication by our employees to you should be deemed as personalized investment advice. We expressly forbid our writers from having a financial interest in any security recommended to our readers. All of our employees and agents must wait 24 hours after on-line publication or 72 hours after the mailing of printed-only publication prior to following an initial recommendation. Any investments recommended by Investment U should be made only after consulting with your investment advisor and only after reviewing the prospectus or financial statements of the company.
Investment U Archive |
© 2005-2022 http://www.MarketOracle.co.uk - The Market Oracle is a FREE Daily Financial Markets Analysis & Forecasting online publication.


