Shanghai China Stocks Sink: Déjà vu 2001 & 2007…All Over Again
Stock-Markets / Chinese Stock Market Jun 21, 2015 - 02:59 PM GMTBy: I_M_Vronsky
 What is occurring today in China’s Shanghai Stock Index can best be described by Yogi Berra’s famous line: “Déjà vu 2001 & 2007…All Over Again.”
Almost 85% of China-listed companies are trading at higher multiples today than they did at the previous market top in 2007…just before the crash.
The Shanghai Stock Index began crashing in 2001 and again in 2007…as depicted in the chart below.
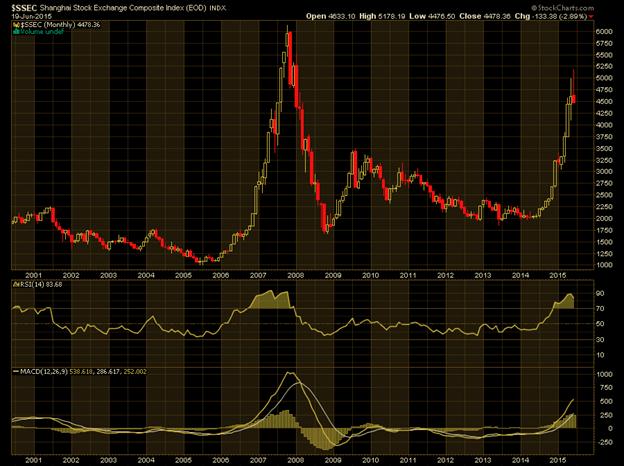
2001-2005 Shanghai Stock Crash
Shanghai Index was relentlessly hammered down 55% during 49 months.
2007-2008 Shanghai Stock Crash
Shanghai Index mercilessly plummeted 72% during only 12 months.
And in June 2015, the Shanghai Index echoes: Déjà vu 2001 & 2007…All Over Again
The above chart clearly shows Technical Indicators (oscillators) RSI and MACD have again recently maxed out as they did in 2001 and 2007…thus heralding an imminent correction. Moreover, the Shanghai Composite Stock Index has risen with accentuated irrational exuberance by soaring hyperbolically +150% in a mere 13 months…which is irrational exuberance high on Cocaine!
Not only RSI and MACD oscillators are at maximum high levels, the chart above shows last month’s movement as a Spinning Top (signifying provocative indecision of investors).
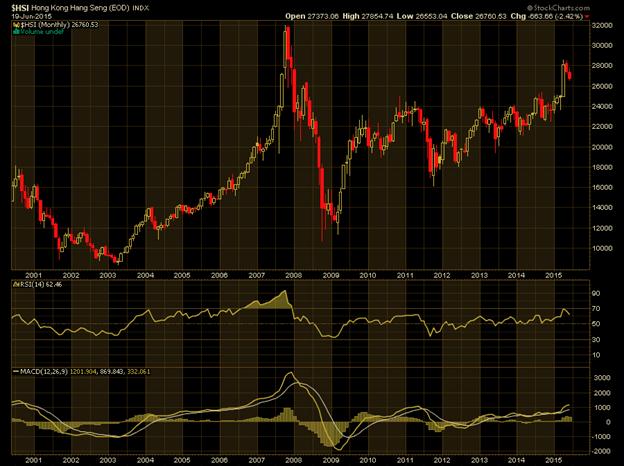
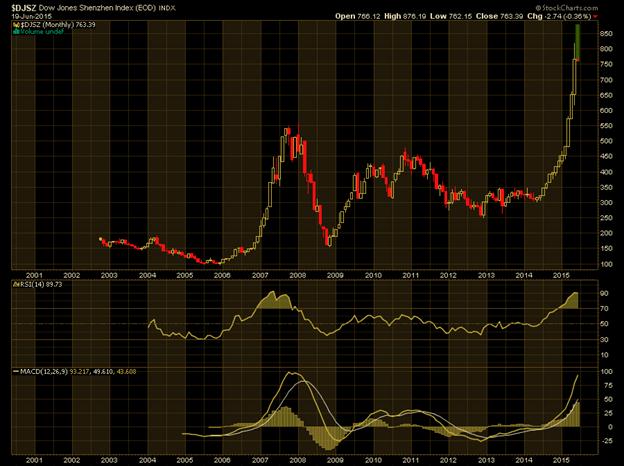
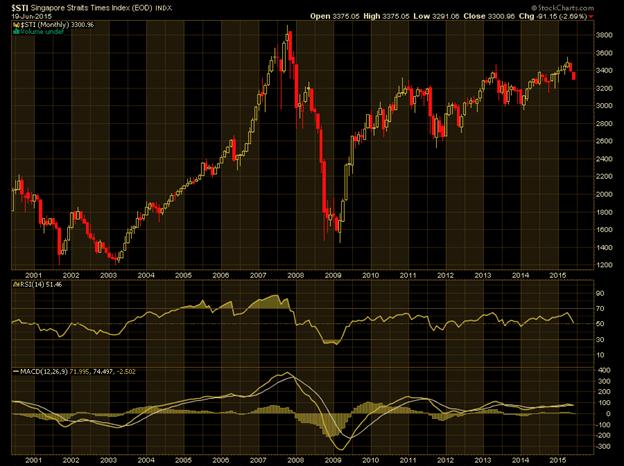
And although the Shanghai Index is forecasting an impending Bear Market, it is not alone. We also see Asian bears emerging in the Hang Seng Stock Index of Hong Kong, Shenzhen China Stock Index and the Singapore Straits Times Index…likewise all displaying peaking patterns…of nascent Bear Markets…as they all did in 2001 and 2007.
Hang Seng Index of Hong Kong
Shenzhen China Stock Index
Singapore Straits Times Index
PEK Market Vectors China ETF
PEK is considered by several Asian market pundits as the bellwether for China stocks. And although this ETF did NOT exist before 2011, its price has soared 151% during the past 13 months. Moreover, the Technical Indicators of RSI and MACD are grossly maxed out…suggesting a material correction looms on the horizon. See chart below:
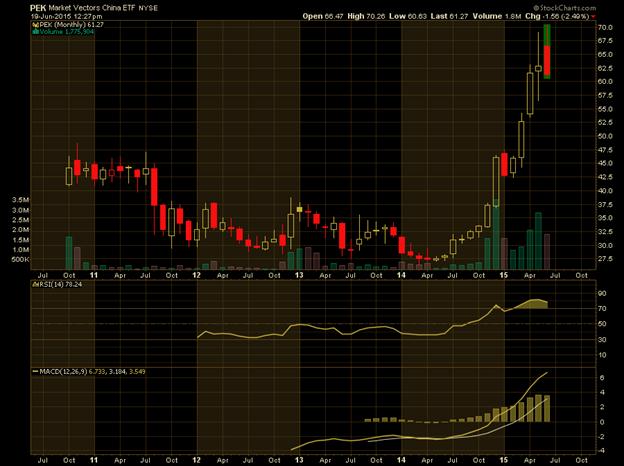
With economic growth materially slowing in China, there is little reason…nor fundamentals for a sustained near vertical rise in Chinese Stock prices during the past 8 months. Indeed, history is testament that nearly vertical levitation in stock prices is always followed by vertical free-fall crashing stock values…as greed virally mutates into fear and panic.
And as Asian Stock Markets succumb to reason and common sense, the Asian Bear influence may well cross the ocean to the Western World. Specifically, US and Euro Union stock prices might easily fall in concert with Shanghai, Shenzhen, Hong Kong and Singapore stock markets.
Forecast For Shanghai Stock Index
Based upon the above analysis and history, it is conceivable the Shanghai Stock Index might decline to the 2000 level support by the end of next year…representing more than a 50% plunge from today’s level. Likewise, the other Asian Stock Indices will most probably decline in concert with Shanghai stocks.
A parting shot: One French bank has described the Chinese equity market as “impending doom” which could be good for the gold market in the long-term
By I. M. Vronsky
Editor & Partner - Gold-Eagle
www.gold-eagle.com
Founder of GOLD-EAGLE in January 1997. Vronsky has over 40 years’ experience in the international investment world, having cut his financial teeth in Wall Street as a Financial Analyst with White Weld. He believes gold and silver will soon be recognized as legal tender in all 50 US states (Utah and Arizona having already passed laws to that effect). Vronsky speaks three languages with indifference: English, Spanish and Brazilian Portuguese. His education includes university degrees in Engineering, Liberal Arts and an MBA in International Business Administration – qualifying as Phi Beta Kappa for high scholastic achievement in all three.
© 2015 Copyright I. M. Vronsky - All Rights Reserved
Disclaimer: The above is a matter of opinion provided for general information purposes only and is not intended as investment advice. Information and analysis above are derived from sources and utilising methods believed to be reliable, but we cannot accept responsibility for any losses you may incur as a result of this analysis. Individuals should consult with their personal financial advisors.
© 2005-2022 http://www.MarketOracle.co.uk - The Market Oracle is a FREE Daily Financial Markets Analysis & Forecasting online publication.


