The Biggest Myth About Investing in Crude Oil Right Now
Commodities / Oil Companies Jun 18, 2015 - 03:35 PM GMTBy: Investment_U
 Matthew Carr writes: I’m not often bearish. It’s not really in my nature. And it certainly doesn’t fit in my philosophies of “don’t panic” and “you can always find opportunities (regardless of which way the broad market is moving).”
There are ways to make money in any situation.
That said, in April 2013 I did give a warning about the energy sector. My exact words:
“The days of $100-a-barrel crude are winding down (barring some major supply chain disaster). U.S. stockpiles of crude are at multidecade highs. Stockpiles are more than 4% higher compared to this time last year - and the five-year average was already way out of whack.”
I was a little early, as prices didn’t come crashing down until 14 months later. But here we are...
And now that everyone has fled the crude markets, I’m seeing plenty of opportunities. In fact, as The Oxford Club’s trends expert, I think this could be the biggest emerging trend I’ve covered in recent months.
You see, unbeknownst to many, there have been lots of big returns in the energy sector this year. I’m not talking safe havens like tankers and MLPs, either...
At the Bottom of the Long Way Down
If you follow the energy sector, you probably know that every Friday afternoon, Baker Hughes (NYSE: BHI) releases weekly rig counts for North America and monthly international activity.
Everyone focuses on the headline number, but... we get it. Rig counts are down.
Over the past year, the North American rig count has fallen 53%. In the United States, specifically, the rig count is down a little more - 53.67%.
At the same time, however, not a lot of press is given to the fact that working rigs in the U.S. peaked more than three years ago - in October 2011.
It’s been declining ever since, except for a couple of really active areas.
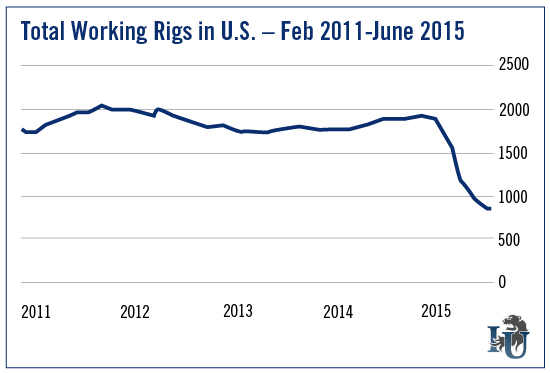
The problem is the ever-changing mix of natural gas and oil.
In recent years, the vast majority of rigs shifted to oil. It’s happened several times before, and it’ll happen plenty of times again.
When the industry focuses on just one side, there’s an implosion. Supply outstrips demand and we have a cascading collapse.
But, obviously, not everything is created equal. Right now, some basins are getting hit harder than others. While some basins are seeing their rig counts increase.
Seven fields in the United States - the Bakken, Eagle Ford, Haynesville, Marcellus, Niobrara, Permian and Utica - account for 95% of all growth in domestic oil and gas production.
And these are the plays - particularly the Permian - that account for the massive drop in rig counts.
A Dramatic Shift... and a Host of Outperformers
If we look at the working rigs by comparable activity, the picture is a little more interesting...
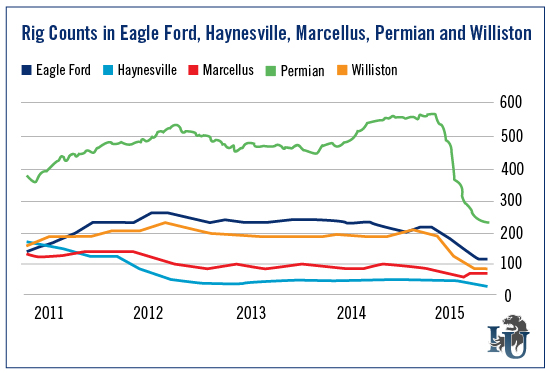
Here, we see counts at the Haynesville and Marcellus have been on a decline since 2011 and 2012. The Eagle Ford activity peaked in early 2012 and was largely flat. And the Williston (part of the Bakken) saw a steady flow of activity.
The Permian has had the most dramatic shift. As you can see, it continued to add working rigs until November 2014.
By the end of October 2014, the Permian accounted for 29.5% of all onshore working rigs.
As of last week, Permian activity represented 27% of active rigs. And of the 1,069 rigs taken offline since October 2014, the Permian losses were 336, or 31.4% of that total.
iuox.display(71);
At the moment, new Permian activity is at its lowest point since 2010. But it does produce the most crude of any basin in the U.S.
A lot of people have been negative on oil producers this year. With crude prices so low, energy investors have generally focused on refiners, tankers and pipelines.
But the thing is, just because rig counts are going down... that doesn’t mean oil companies’ shares will follow.
Let’s look at a year-to-date chart on Permian operators...
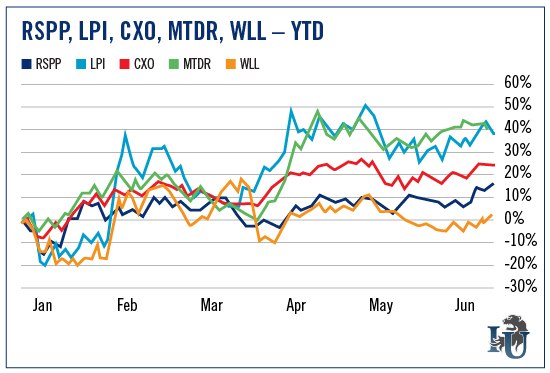
Not only did this group - Matador Resources (Nasdaq: MTDR), RSP Permian (Nasdaq: RSPP), Laredo Petroleum (NYSE: LPI), Concho Resources (NYSE: CXO) and Whiting Petroleum (NYSE: WLL) - largely destroy the performance of the energy sector...
It outperformed the broader markets as well.
RSP Permian is actually forecasting year-over-year revenue growth of 20%-plus. Laredo is expecting a decline of 18% (which is far below the industry average). Wall Street is anticipating a full-year decline in revenue for Matador of just 7.5%. And Concho Resources is projected to see revenue dip only 15.7%. Whiting, which is the worst performer so far, will likely see revenue fall 19%.
The standout here, obviously, is RSP Permian, which saw production increase 86% in the first quarter. The company deferred its well completions in the fourth quarter until costs stabilized. It also plans to accelerate drilling activity in the second half of 2015.
Where Skies Are Brighter
Despite the overall negative sentiment in energy, there are areas of growth.
Smaller plays, such as the Cana-Woodford and the Ardmore Woodford, are seeing their rig counts increase.
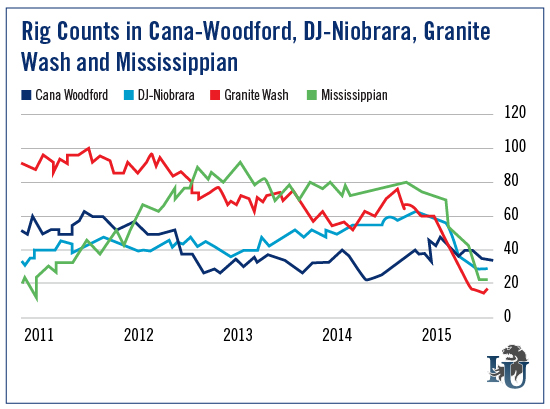
Over the past year, the Cana-Woodford is seeing a 26.87% increase in activity. The Ardmore Woodford is seeing a 16.87% increase.
As you can see from the chart, the Cana-Woodford is down from 2011, but the activity wasn’t decimated like in other basins. And we actually see rig counts in the Granite Wash and Mississippian, after bottoming, are ticking higher.
Now, this is where digging into the data further - going beyond the headlines - is important
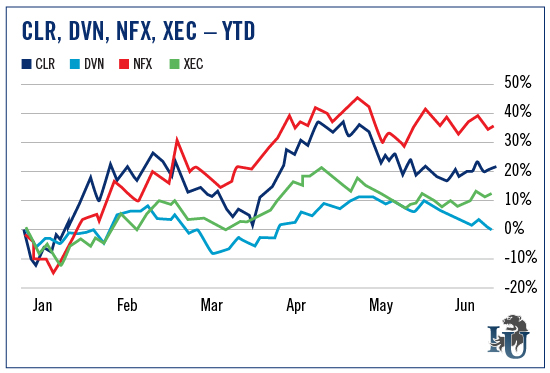
Continental Resources (NYSE: CLR) is the largest operator in the Cana-Woodford. Shares of Continental are up 22.4% this year. Meanwhile, competitor Newfield Exploration (NYSE: NFX) is up more than 35%. And Cimarex Energy (NYSE: XEC) is up more than 13%.
The declines in the broad energy sector have been capped and have slowed considerably, even as production continues to increase. But in no way does that mean investors have to abandon oil companies. It’s about being more selective.
Everyone is a genius in a bull market. But it’s in the bear markets that you start separating yourself from the pack. You must dig through the data to find opportunities.
Good investing,
Matt
Copyright © 1999 - 2015 by The Oxford Club, L.L.C All Rights Reserved. Protected by copyright laws of the United States and international treaties. Any reproduction, copying, or redistribution (electronic or otherwise, including on the world wide web), of content from this website, in whole or in part, is strictly prohibited without the express written permission of Investment U, Attn: Member Services , 105 West Monument Street, Baltimore, MD 21201 Email: CustomerService@InvestmentU.com
Disclaimer: Investment U Disclaimer: Nothing published by Investment U should be considered personalized investment advice. Although our employees may answer your general customer service questions, they are not licensed under securities laws to address your particular investment situation. No communication by our employees to you should be deemed as personalized investment advice. We expressly forbid our writers from having a financial interest in any security recommended to our readers. All of our employees and agents must wait 24 hours after on-line publication or 72 hours after the mailing of printed-only publication prior to following an initial recommendation. Any investments recommended by Investment U should be made only after consulting with your investment advisor and only after reviewing the prospectus or financial statements of the company.
Investment U Archive |
© 2005-2022 http://www.MarketOracle.co.uk - The Market Oracle is a FREE Daily Financial Markets Analysis & Forecasting online publication.


