


Gold Price Ratio Signals
Commodities / Gold and Silver 2015 Jun 17, 2015 - 12:44 PM GMTBy: Gary_Tanashian

 A brief snapshot of counter-cyclical gold’s macro signals vs. other metals (and broad commodities) that are more positively correlated to economies, using weekly charts…
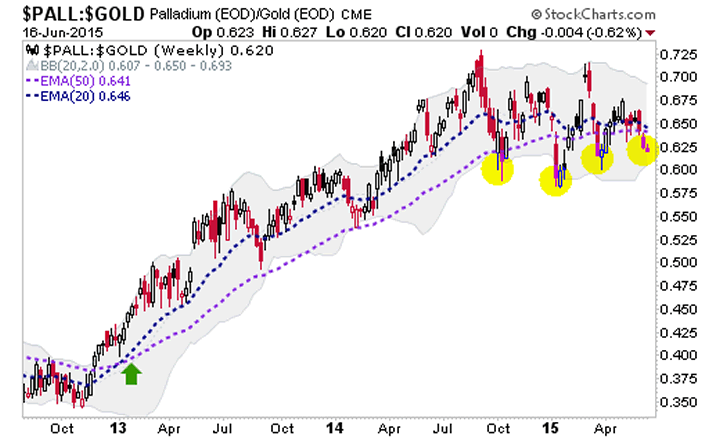
Each week NFTRH updates many charts of nominal US and global stock markets, commodities, precious metals and currencies over multiple time frames. But we also cover economic data and indicators, with the first macro chart below (Palladium vs. Gold) still barely holding its economic ‘UP’ signal from January, 2013. At that time a coming economic up phase did not seem likely, but PALL-Gold and fundamental information gleaned from a personal source in the Semiconductor Equipment sector gave us a good risk vs. reward on that stance.
While it can be argued that using an indicator like Palladium (positive economic correlation) to Gold (counter cyclical) is subject to the discrete supply/demand fundamentals of the two assets, it has worked to signal up and down economic phases, with the most recent shown in Q1 2013 (green arrow). This indicator has been whipsawing since topping out a year ago and the moving averages are near a trigger point.
A related indicator is Gold vs. Commodities. Gold-CRB made an impulsive rise in late 2014 as the global deflationary phase topped out. As policy makers (ECB, BoJ, China Central Planning and US with ongoing ZIRP) continue to promote inflation 24/7, 365 Gold-CRB has dropped as it should when inflation is starting to ‘work’ and inflation expectations start to take hold. But a problem for hopeful inflationists is that so far at least, counter-cyclical Gold-CRB appears to be in a bullish consolidation.
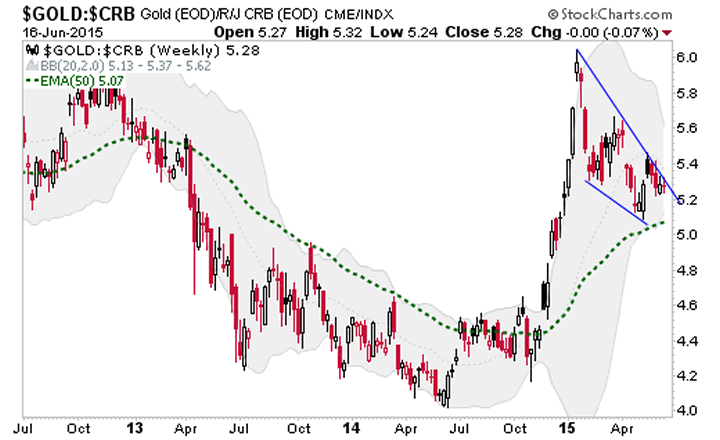
If cyclical PALL-Gold were to break down and counter-cyclical Gold-CRB to hold support and resume its uptrend the indication for the global economy would be negative.
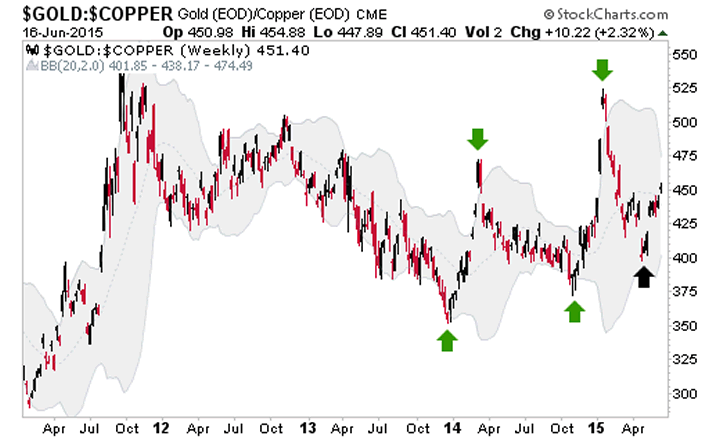
Another chart worth considering is Gold vs. Copper, the traditionally cyclical red industrial metal. A series of higher highs and higher lows began in late 2013 and is still in play.
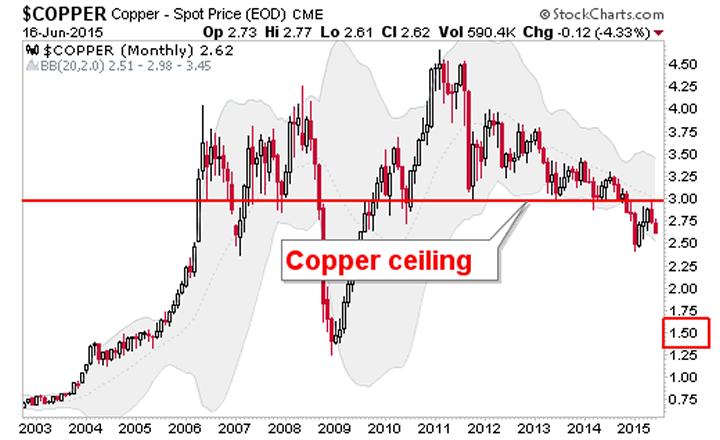
To put perspective on this, behold how bearish nominal Copper is and has been by viewing this monthly chart similar to those we have reviewed in NFTRH for years now to maintain a big picture bearish outlook on this metal. We have allowed for the current bounce/rally/bear flag, but until $3/lb. is exceeded and held, this is a very bearish picture.
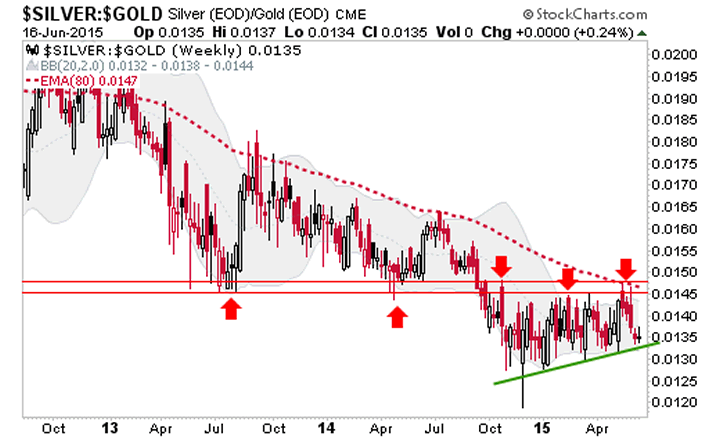
Finally, let’s review Gold vs. its primary running mate, Silver. Actually, flipping Gold vs. Silver over to the Silver-Gold ratio works best visually at this time.
We are allowing for a bounce in Silver vs. Gold. This could come about if the Fed rolls over again today and plays nice with its language. Or it could just come about simply because it is due. This would go hand in hand with a resumption of the mini inflation bounce implied in TIPs vs. regular Treasury bonds and in nominal Treasury bond yields. The message of Silver-Gold however, is similar to the charts above on the bigger picture because it is locked below very strong resistance.
Bottom Line
I consider Gold vs. Palladium and Gold vs. Copper to be indicators on the global economy whereas Silver vs. Gold is more an early indicator on inflationary pressure.
The conclusion is that the economy is in danger of decelerating (Pd-Au, Au-CRB, Au-Cu) amidst a dis-inflationary environment (Ag-Au). The timing could be by this fall. First, a resumed bounce in the ‘inflation trade’ has a chance to get reanimated. But that is not the dominant longer-term trend.
Subscribe to NFTRH Premium for your 25-35 page weekly report, interim updates (including Key ETF charts) and NFTRH+ chart and trade ideas or the free eLetter for an introduction to our work. Or simply keep up to date with plenty of public content at NFTRH.com and Biiwii.com.
By Gary Tanashian
© 2015 Copyright Gary Tanashian - All Rights Reserved
Disclaimer: The above is a matter of opinion provided for general information purposes only and is not intended as investment advice. Information and analysis above are derived from sources and utilising methods believed to be reliable, but we cannot accept responsibility for any losses you may incur as a result of this analysis. Individuals should consult with their personal financial advisors.
Gary Tanashian Archive |
© 2005-2022 http://www.MarketOracle.co.uk - The Market Oracle is a FREE Daily Financial Markets Analysis & Forecasting online publication.