


George Lindsay's Stock Market Dow Right Shoulder
Stock-Markets / Stock Markets 2015 Jun 17, 2015 - 07:22 AM GMTBy: Ed_Carlson

As explained in previous commentaries, the Dow is sketching out a Right Shoulder (following the end of the Basic Advance last July) which is higher than the high of the Basic Advance. The preserved written work of Lindsay reveals no attempt on his part to forecast the high of a Right Shoulder - only his warning to expect one following an extended Basic Advance (929-968 days)and that it can rise to a level higher than the end of the Basic Advance. This happened in 1966 and 1973, and has occurred again in the current bull market.
Taking a look at those previous "higher" Right Shoulders reveals that while the standard approach of using confirming Middle Sections to forecast the high of the Basic Cycle worked well in 1973, it failed in forecasting the high in 1966 when only one of the two expected Middle Section forecasts pointed to that high.
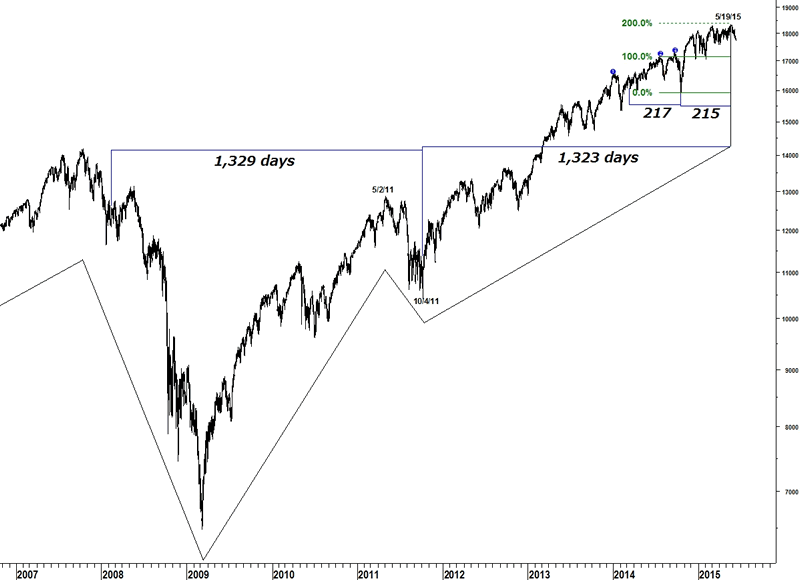
What the highs in 1966 and 1973 both had in common were Middle Section forecasts centered on the low of the current basic cycle and the high of the previous basic cycle. The 5/19/15 high has no Middle Section forecast from the high of the previous basic cycle (5/2/11) but it does have a 1,323 day forecast from the low of the current basic cycle (10/4/11).
In addition, it has a 217 day forecast centered on the low of the Separating Decline (10/16/14) similar to the 1966 high (1973 did not have a Three Peaks/Domed House formation).
As of June, at 11 months beyond the high of the Basic Cycle last July, the Right Shoulder is stretched to its limit. Like Sideways Movements, no right shoulder has ever lasted more than 11 months.
The rally from the low on 10/16/14 (following the high of the Basic Advance) to the high on May 19 is equal to 200% of the distance from the high of the Basic Advance last July to the low in October. Fibonacci relationships like this one also existed at the two previous "higher" Right Shoulders; the final rally to the high in 1966 was 161.8% of the decline following the end of the Basic Advance and the final rally to the high in 1973 was 238.2% of the decline following the end of the Basic Advance.
Try a "sneak-peek" at Lindsay research (and more) at Seattle Technical Advisors.
Ed Carlson, author of George Lindsay and the Art of Technical Analysis, and his new book, George Lindsay's An Aid to Timing is an independent trader, consultant, and Chartered Market Technician (CMT) based in Seattle. Carlson manages the website Seattle Technical Advisors.com, where he publishes daily and weekly commentary. He spent twenty years as a stockbroker and holds an M.B.A. from Wichita State University.
© 2015 Copyright Ed Carlson - All Rights Reserved
Disclaimer: The above is a matter of opinion provided for general information purposes only and is not intended as investment advice. Information and analysis above are derived from sources and utilising methods believed to be reliable, but we cannot accept responsibility for any losses you may incur as a result of this analysis. Individuals should consult with their personal financial advisors.
© 2005-2022 http://www.MarketOracle.co.uk - The Market Oracle is a FREE Daily Financial Markets Analysis & Forecasting online publication.