


Stock Market Failed Rally?
Stock-Markets / Stock Markets 2015 Jun 15, 2015 - 02:26 PM GMTBy: Andre_Gratian

 Current Position of the Market
SPX: Long-term trend - Bull Market
Intermediate trend - Waiting for confirmation that the ending triangle is complete.
Analysis of the short-term trend is done on a daily basis with the help of hourly charts. It is an important adjunct to the analysis of daily and weekly charts which discusses the course of longer market trends.
A FAILED RALLY?
Market Overview
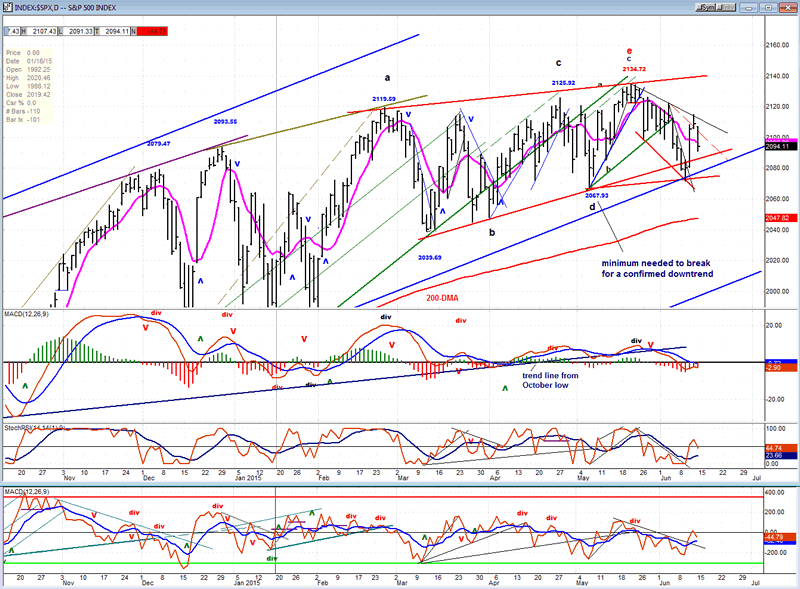
On 5/20 SPX ostensibly completed an ending diagonal pattern at 2135 and started to correct. When it made its top, it also created a short term distribution phase that had a P&F count to 2076. After declining for three weeks, that projection was met and a rally started. The completion of the diagonal suggested that a top of intermediate proportion had been made, but by rallying from 2072 -- although this was expected -- the retracement came short of confirming that an intermediate decline was underway. This is why it becomes important to scrutinize the rally from that level.
When the index rallied past the 50% retracement level, some doubt was created by the market's action. Had the diagonal been mislabeled and were we starting another challenge to the former high? The bears were somewhat reassured when some weakness began to re-assert itself on Friday, but some follow through on the downside will be needed to suggest that we have a failed rally.
Nor can the short-term structure be assessed correctly until we have more data. All that can be said is that we closed the week in a neutral position and that we will need to wait for more clarity regarding the short-term trend.
Indicators survey
The weekly momentum indicators continue their correction with no sign of a bottom forming.
The daily MACD turned up, but stopped just short of making a bullish cross. The daily A/D MACD could not go beyond the zero line and turned back down.
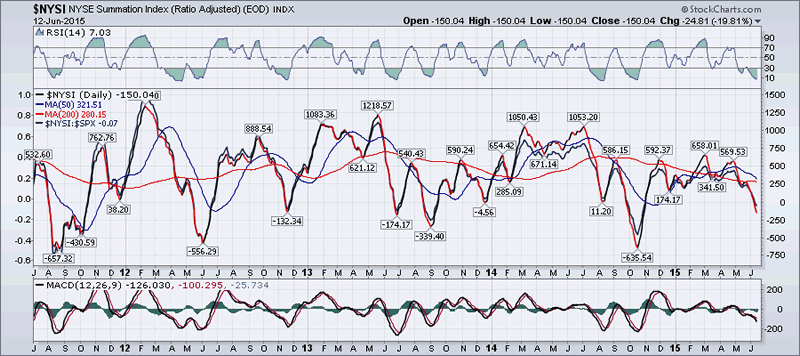
After making what could be construed as an H&S formation, the NYSE Summation Index (courtesy of MarketCharts.com) started a decline which continued into this week. Its indicators also continue to decline with not sign of divergence forming.
As a result of the distribution which occurred above 2068 the 3X P&F chart has created a topping pattern, but dropping below that level will be required to activate the downside count. Should that happen, we can look forward to much lower lows than what has already been achieved in the decline from 2135.
Chart Analysis
We'll start with the Daily SPX (chart courtesy of QCharts.com, including others below). Even though the index did trade below the lower trend line connecting the lows of the ending diagonal, the fact that it filled a short-term phase count and also found support at the intersection of two trend lines at the 2072 level prevented it from immediately extending its decline below 2068, which is what was needed to make a lower low and confirm that a larger downtrend had begun. Instead it bounced sharply back inside its diagonal pattern before finding some resistance at a minor declining trend line.
Friday's pull-back and close kept it in a downtrend, giving hope to the bears that additional weakness is right around the corner. If the decline resumes on Monday and, especially, if it continues conclusively below the 2068 level, we can assume with some confidence that we have established an important downtrend.
Although the bounce was sharp, it was not sustained long enough to turn the indicators completely, although an extension of the rally certainly would, and this would change our interpretation of the market's intentions. Next week, the index could be buffeted by news about Greece and the Fed and it may take a few days to set the trend.
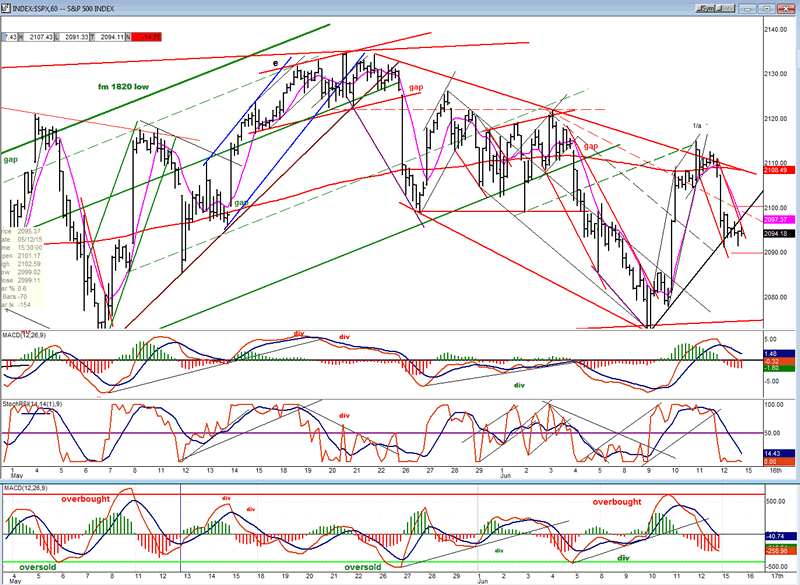
The hourly chart shows clearly that the move down from 2135 occurred in only two phases, and this casts some doubt on the completion of the diagonal pattern and the start of an extended decline. If the move to 2072 was only a corrective wave, we could still see another challenge to the high before a top is made. Furthermore, the rally from the low came in a 5-wave pattern and the correction dried up almost immediately, which brings up the possiility that it may have ended in the last hour on Friday.
The sideways move after the first couple of hours allowed the indicators to stabilize, and they are now in a position to confirm another short-term uptrend if there is no follow-through weakness on Monday and prices start up instead.
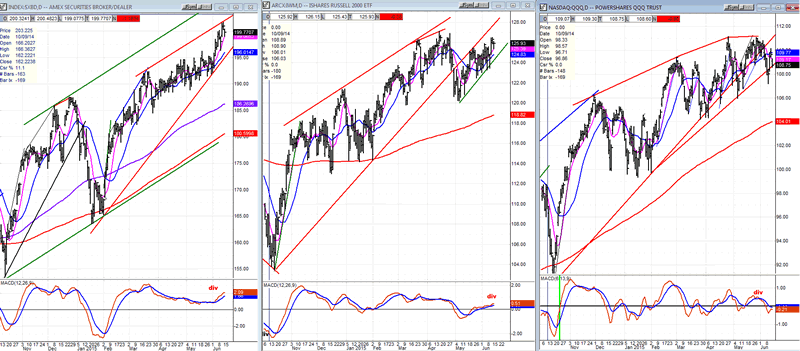
XBD - IWM - QQQ
These three indexes are considered to be market leaders. A quick glance at their daily charts from the October low shows that even though they do not have exactly the same pattern, they all show a wedge formation. IWM has already come out of it and is rallying on the outside, perhaps re-testing its high; QQQ is trying to break out of it. The top line of the XBD wedge has been drawn arbitrarily since it just made a new high last week, and it could still go higher, although it has now reached the lower level of its projection target.
With the exception of XBD which has still not made a confirmed wedge pattern, the other two appear to be making topping formations. This is substantiated by their MACDs which are displaying negative divergence. By this criterion alone, QQQ is currently the weakest.
But the point that I really want to make is that not one of these can be said to have made a reversal. Until they do, we have to assume that SPX has not, either.
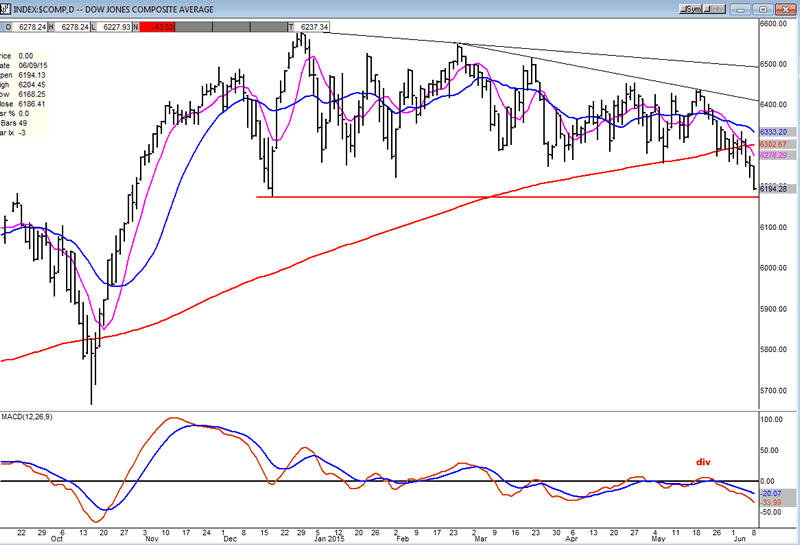
Dow Jones Composite
By contrast to the indexes shown above, it would be difficult not to see the following formation as a descending triangle or a rounding top. Either one is a bearish pattern with prices already trading below the 200-DMA. Last week, the lowest point since the October low was breached, but the index rallied in a last-ditch effort to prevent it from giving a major sell signal -- but for how long?
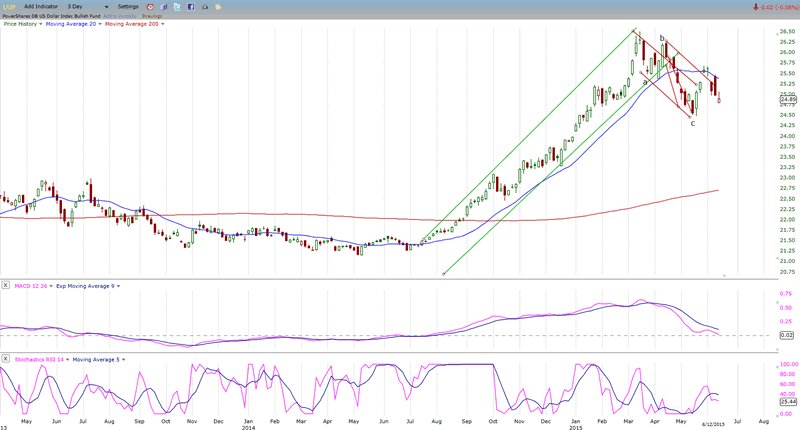
UUP (dollar ETF)
UUP could not follow through immediately on its attempt to resume its uptrend. More consolidation may be needed.
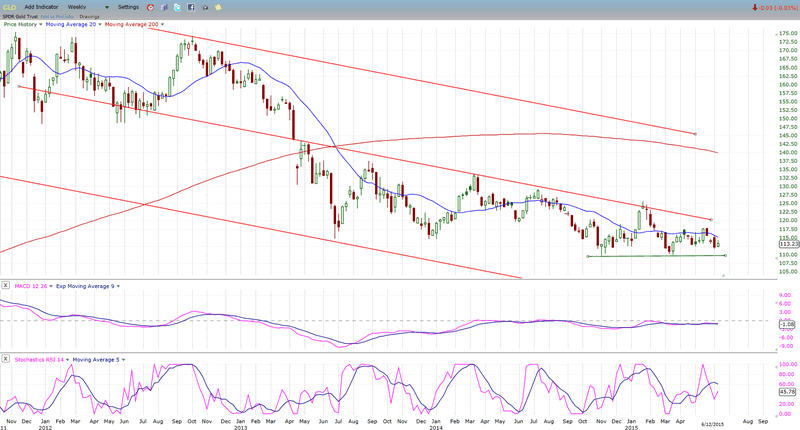
GLD (Gold trust)
GLD is nearing an important time frame when larger cycles are deemed to turn up. It is not clear if it will continue to trade sideways, or if it is preparing for a final mini-climax which will mark its low. He next two or three weeks will let us know.
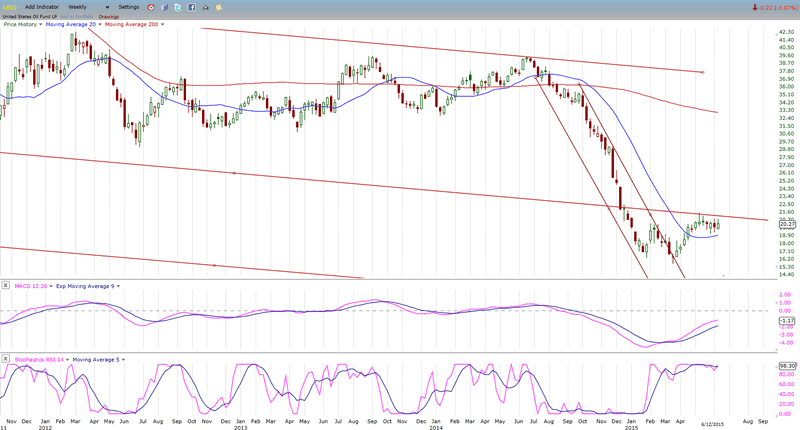
USO (US Oil Fund)
USO is also stuck in a sideway move, but the indicators still favor a resumption of the downtrend when price moves below the 20-wk MA.
Summary
"Even with the recent weakness, there is still too great a lack of uniformity among the various market components to even suggest that an intermediate decline is under way."
Filling a P&F projection is nearly always followed by a move in the opposite direction. This, and other factors caused SPX to rally strongly last week. Nevertheless, there is still enough ambiguity to prevent determining with accuracy the near-term index direction, but there is a good chance that some issues that have kept the market ambivalent will be resolved next week - none too soon!
FREE TRIAL SUBSCRIPTION
If precision in market timing for all time framesis something that you find important, you should
Consider taking a trial subscription to my service. It is free, and you will have four weeks to evaluate its worth. It embodies many years of research with the eventual goal of understanding as perfectly as possible how the market functions. I believe that I have achieved this goal.
For a FREE 4-week trial, Send an email to: info@marketurningpoints.com
For further subscription options, payment plans, and for important general information, I encourage
you to visit my website at www.marketurningpoints.com. It contains summaries of my background, my
investment and trading strategies, and my unique method of intra-day communication with
subscribers. I have also started an archive of former newsletters so that you can not only evaluate past performance, but also be aware of the increasing accuracy of forecasts.
Disclaimer - The above comments about the financial markets are based purely on what I consider to be sound technical analysis principles uncompromised by fundamental considerations. They represent my own opinion and are not meant to be construed as trading or investment advice, but are offered as an analytical point of view which might be of interest to those who follow stock market cycles and technical analysis.
Andre Gratian Archive |
© 2005-2022 http://www.MarketOracle.co.uk - The Market Oracle is a FREE Daily Financial Markets Analysis & Forecasting online publication.