Silver Price Lows and Bond Market Bubbles
Stock-Markets / Stock Markets 2015 Jun 13, 2015 - 02:05 PM GMTBy: DeviantInvestor
 T bonds have been levitated higher as central banks aggressively pushed their “Inflate or Die” QE process.
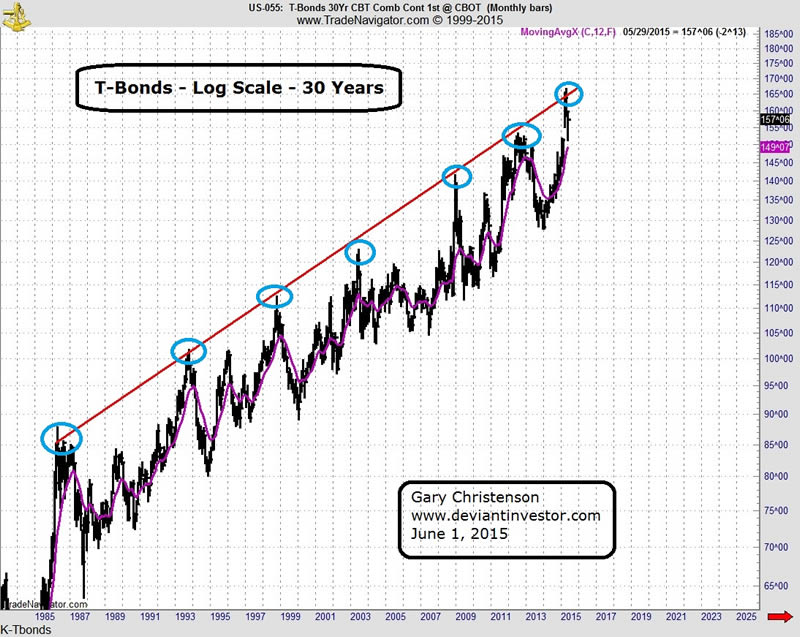
Examine this log scale chart of monthly T bonds since 1985. I have drawn a red line that more or less connects the most significant tops in the past 30 years.

- After each touch of the thirty year log-scale resistance line the T-bond market fell substantially.
- Peaks have occurred about every six years with an extra peak in 2012.
- The rise over the past 17 months has been steep.
- Yields are at all-time lows and prices are amazingly high. It looks like a bubble.
WHAT ABOUT SILVER?
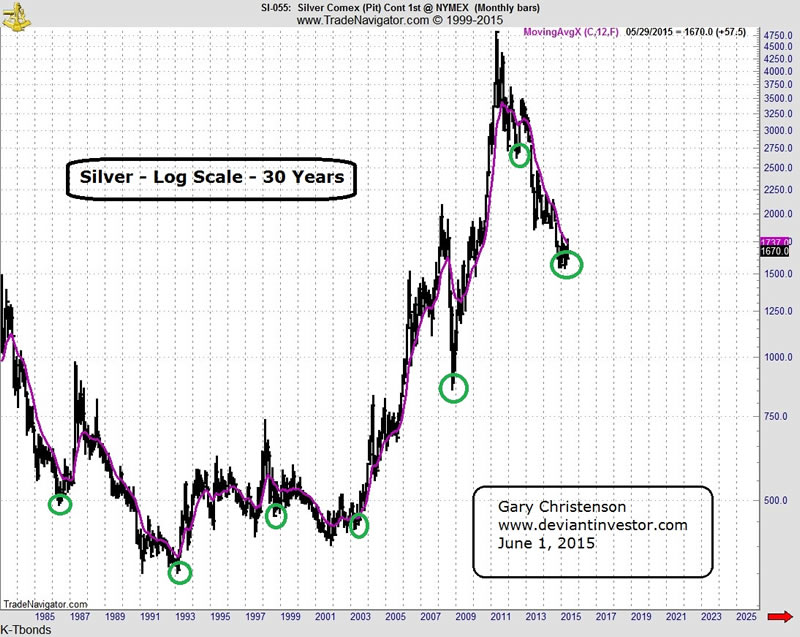
Examine the following chart.

- The green circles on the silver chart show the important HIGHS in the bond market.
- The 1986, 1993, 2008, 2012 and 2015 lows on the silver chart match the T-bond highs quite well.
- The 1998 and 2003 T-bond highs occurred after the silver market lows that occurred in 1997 and late 2001.
- Silver prices rebounded after all of those lows.
- The rebounds after the 1998 and 2012 lows were small. The other lows produced sizable rallies. I assume we will soon see a sizeable rally after the March 2015 silver low, but we wait for confirmation.
- T bonds are financial and paper assets. It makes sense that major highs in bonds would occur near major lows in commodities, such as silver.
But there is more!
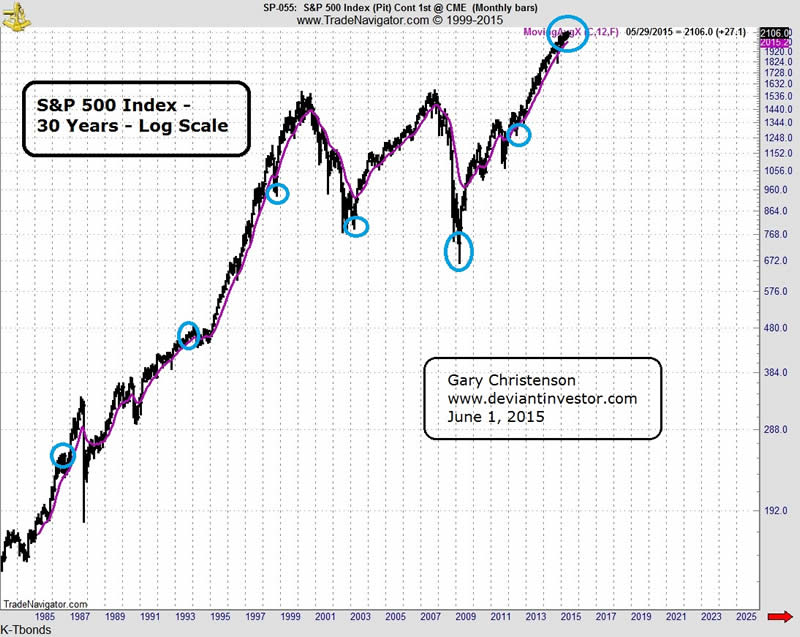
Examine the log scale chart of the S&P for 30 years.

- Note that T-bond HIGHS in 1998, 2003, 2008 and 2012 match the LOWS in the S&P at approximately the same time.
- But the 2015 S&P high violates the pattern seen in bonds since 1997. Based on the past 20 years, the 2015 T-bond high should have marked a major LOW in the S&P. It did not. Both the bonds and the S&P hit a significant high in 2015. Was this a double-bubble high?
COMMENTS:
- Bonds look like they have bubbled up to an unsustainable level.
- Instead of an S&P low in 2015 we see an S&P high. I think the S&P, thanks to QE, has also bubbled into a major high.
- QE and HFT (High Frequency Trading) are powerful forces supporting the T-bond and stock markets. “Extend and pretend” is alive and well in the T-bond and S&P markets.
- I think bonds and the S&P are vulnerable to a large decline. I think they are likely to drop and that silver will rally.
- Silver bottomed in March 2015. The T-bond high also suggests that silver bottomed.
- Timing bubble tops is difficult. Risk/reward analysis is more appropriate.
SUMMARY:
T bonds and the S&P look dangerous, while silver has been crushed during the past four years. Which of those three asset classes is likely to perform better between now and Election Day 2016? Which of those assets has no counter-party risk? Two of those assets currently trade at or near all-time highs, while one is, relatively speaking, quite inexpensive! Invest accordingly.
Read: “By Almost Every Measure Stocks Are Overvalued”
From Simon Black in Sovereign Man:
“Adam Smith in ‘Supermoney’ wrote a passage so wonderful and so relevant to our current situation that we may have become addicted to its re-use:”
“We are all at a wonderful ball where the champagne sparkles in every glass and soft laughter falls upon the summer air. We know, by the rules, that at some moment the Black Horsemen will come shattering through the great terrace doors, wreaking vengeance and scattering the survivors. Those who leave early are saved, but the ball is so splendid no-one wants to leave while there is still time, so that everyone keeps asking, “What time is it? What time is it?” But none of the clocks have any hands.”
“The clocks may not have hands, but the ticking goes on.
Bond markets are living on borrowed time. Bill Gross may have been a few years early, but he was fundamentally right to suggest that they are resting on a bed of nitroglycerine.”
GE Christenson aka Deviant Investor If you would like to be updated on new blog posts, please subscribe to my RSS Feed or e-mail
© 2015 Copyright Deviant Investor - All Rights Reserved Disclaimer: The above is a matter of opinion provided for general information purposes only and is not intended as investment advice. Information and analysis above are derived from sources and utilising methods believed to be reliable, but we cannot accept responsibility for any losses you may incur as a result of this analysis. Individuals should consult with their personal financial advisors.
Deviant Investor Archive |
© 2005-2022 http://www.MarketOracle.co.uk - The Market Oracle is a FREE Daily Financial Markets Analysis & Forecasting online publication.


