


Stock Market Unconfirmed Downtrend
Stock-Markets / Stock Markets 2015 Jun 08, 2015 - 10:42 AM GMTBy: Andre_Gratian

 Current Position of the Market
SPX: Long-term trend - Bull Market
Intermediate trend - Waiting for confirmation that the ending triangle is complete.
Analysis of the short-term trend is done on a daily basis with the help of hourly charts. It is an important adjunct to the analysis of daily and weekly charts which discusses the course of longer market trends.
UNCONFIRMED DOWNTREND
Market Overview
Last week, SPX completed a 50-point drop from 2135 by finding support on the lower trend line of its ending triangle, at the same time filling a P&F projection to 2086 before bouncing to close the week at 2093. This brings into question if we have really started an intermediate correction, or if more distribution will first be needed.
In order to get a confirmed downtrend, we would not only have to break below the trend line, but also trade below the previous short term low of 2068. The market may not be quite ready for that! After filling its P&F projection at Friday's opening, the index immediately bounced 15 points, and spent the rest of the day consolidating in a narrow range which looks like a classic base building pattern after a climactic move, in preparation for another short-term rally. Furthermore, some of the key market indices have resisted the decline rather well. As an example, XBD made a new high on Friday, and IWM and QQQ are still hanging in there! Also, hourly indicators have started to turn up and could entice the daily to do the same. On the other hand, the weekly indicators are getting weaker and do not look ready to turn.
If we do start another rally, the question remains if there will be enough buyers to send it to a new high or only to a secondary high. The latter should prevail if, in fact, the ending triangle was completed on 5/20 at 2134.72.
We should know as early as Monday if that scenario is going to play out or if we get closer to the confirmation we have been waiting for!
Indicators survey
The weekly momentum indicators continue to weaken with the MACD registering its lowest reading since October (but only by a fraction) and the SRSI is almost at the bottom of its oversold range.
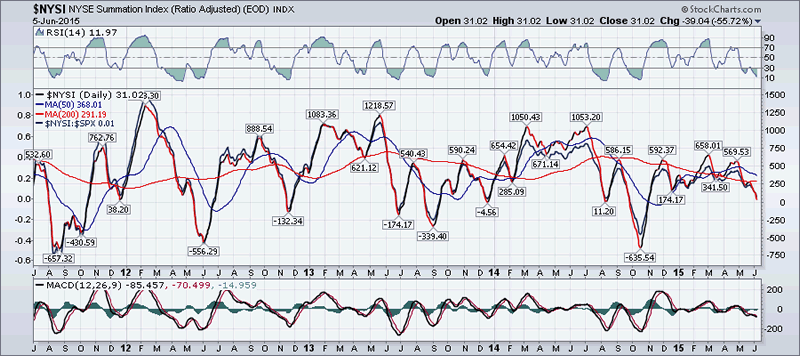
The NYSE Summation Index (courtesy of MarketCharts.com) continues to weaken noticeably with its RSI and the MACD still declining. No sign of reversal here!
The daily momentum indicators are in a position from which they could either turn up or go a little lower. The daily A/D indicator is in the same position but remains negative which is why the SRSI continues to decline.
As stated above, the 1X P&F chart appears to have built a nice base on Friday. Alternatively, if it turns out to be distribution there is enough of a count to take it down to the former projection of about 2075 or lower.
Chart Analysis
We start with the Daily SPX (chart courtesy of QCharts.com, including others below) which shows that it is clearly at a decision point. It is at critical support from both the lower (red) trend line of the ending diagonal, and the (dashed) mid-channel line of the intermediate channel from October 2011. Price held above the green trend line for a week, but accelerated when it broke it. It could continue its acceleration downward if it breaks these two support lines.
Nothing in the indicators suggests that a low has been reached. Most notably, the trend line which had been supporting the MACD lows was decisively breached on 5/29 and the MACD itself appears ready to go negative with no sign of deceleration in its histogram. The other two oscillators are also in downtrends with their MAs in a bearish position. However, there is a tinge of deceleration in the SRSI and some tentative positive divergence in the A/D oscillator.
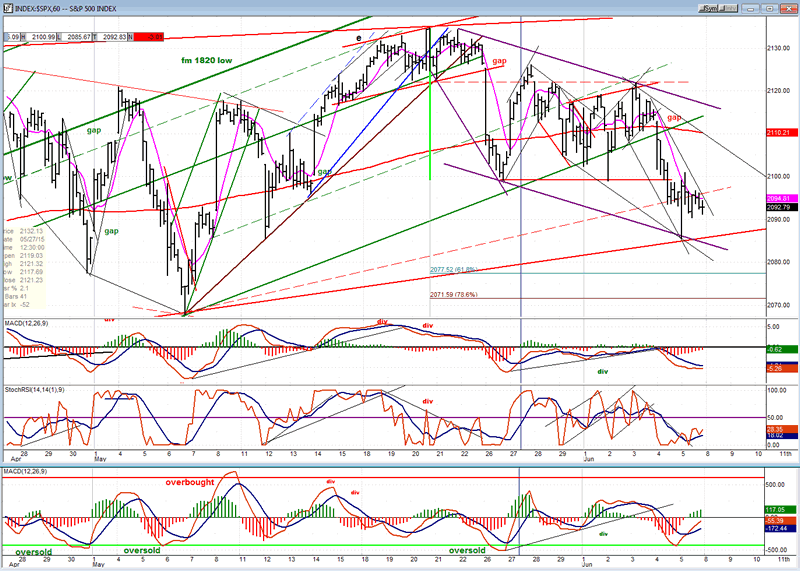
The hourly chart shows clearly how prices found support at an important intersection of the lower diagonal channel line and the bottom channel line of the short-term downtrend. In spite of its recovery from 2086, the index still finished the day inside its steep channel from 2122, but the oscillators make a strong case for a rally to start early next week. Two of the three are already in an uptrend, and it would not take much to turn the MACD as well.
If a rally does start, unless prices can move above the top (purple) channel line before turning down again, it will have to be considered a rally in a downtrend. Currently, the base that was created on Friday allows for a move which would fall well short of that channel line, making the index vulnerable to a potential acceleration of its downtrend after the uptrend runs out of steam.
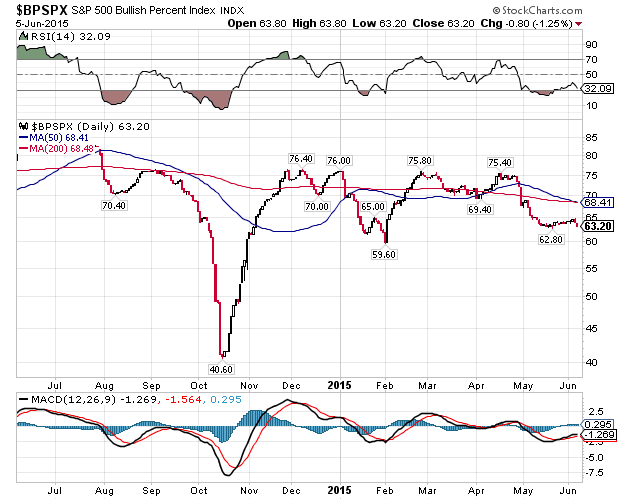
We'll start looking at other indexes by updating a leading index which may be the most reliable of them all since it gave an advance warning of this correction by starting to decline in mid-April. After a consolidation of about three weeks, the daily BPSPX has started to decline again and is now only 3 percentage points from the level reached by the 1980 downtrend. This can be considered negative divergence, especially if that level is surpassed. Actually, the divergence goes back to September when, after the SPX made a new high, the index was only able to get back up to about 76 -- well short of its previous 84. Since then, as SPX made consecutive new highs, that number was never exceeded. And what was the reading on BPSPX when SPX made is high of 2135? It had a high of 63.40. After a rally to 64.80 on 6/6, it closed at 63.20 on Friday. Let's keep a close eye on this one!
This graph's history prior to the 2007 bear market tells us to be especially wary when it gets below 50%.
XBD (American securities Broker/Dealer)
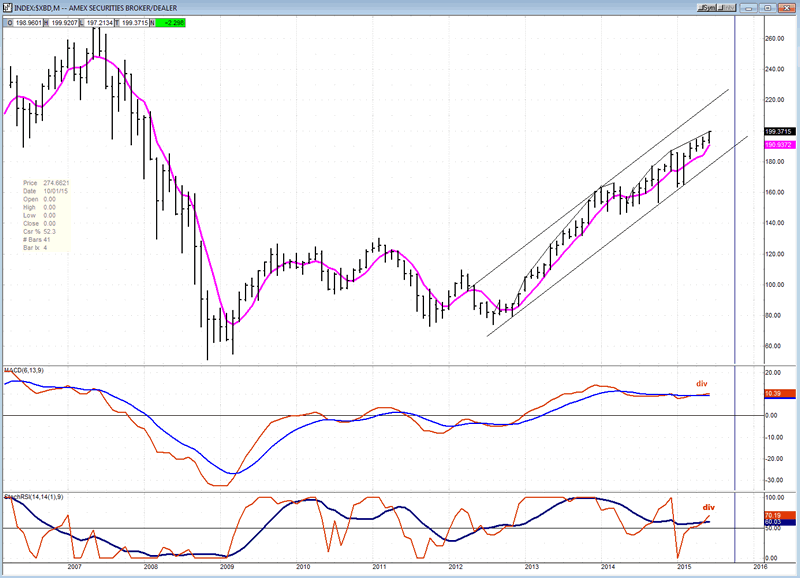
By contrast, the daily XBD made a new high on Friday, suggesting that the SPX could yet make another high. This would seem to support the lack of confirmation that is being displayed by IWM, QQQ, etc...
On a longer term basis, as we can see on the monthly chart below, XBD is not exactly forecasting a bullish future scenario. It is still well below the high that it made in 2007. Also, the momentum oscillators are beginning to show some serious negative divergences which would take an enormous bullish effort to override. That would seem to imply that its current strength is not going to be of a long duration. The substantial base established by XBD until it started its uptrend in October 2011 carries a potential of 2001-2007.
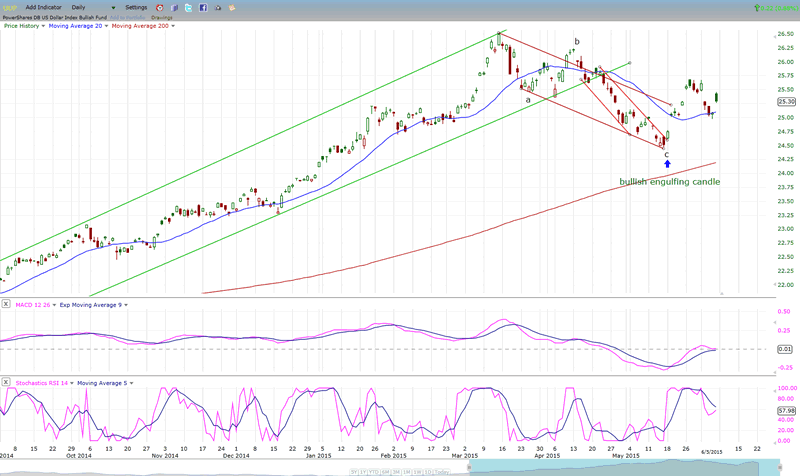
UUP (dollar ETF)
UUP is consolidating its break-out wave and may be just about ready to start its next move up.
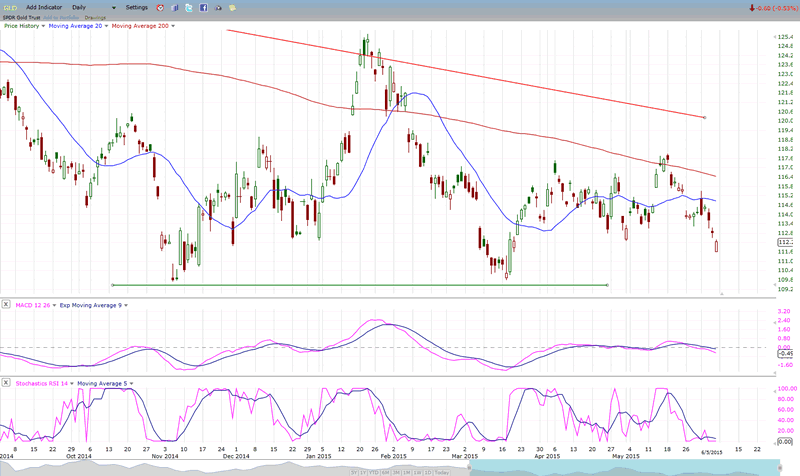
GLD (Gold trust)
GLD continues to go against the impulse that should be provided by the 25-wk cycle which bottomed recently. Larger cycles are suppressing the price and this could continue for the rest of the month and into July.
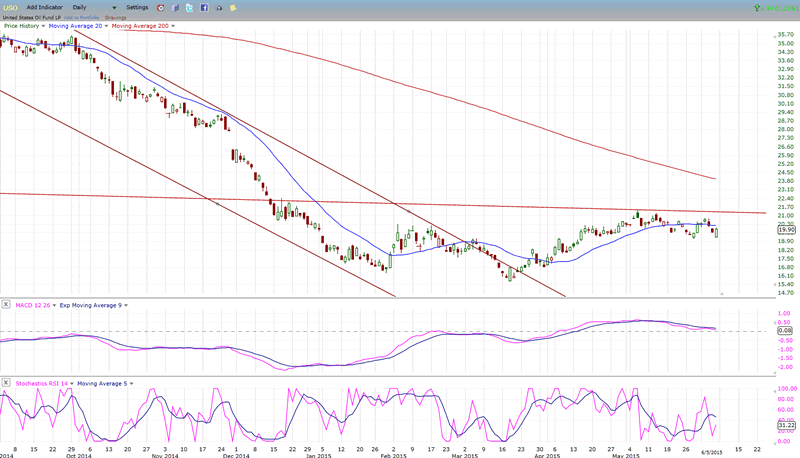
USO (US Oil Fund)
USO is continuing to pause after its lengthy decline. If it cannot soon gather enough strength to go through the (red) mid-channel line of its long-term corrective move, it is likely to resume its decline down to the 13 projection target.
Summary
Even with the recent weakness, there is still too great a lack of uniformity among the various market components to even suggest that an intermediate decline is under way. This implies that the ending triangle pattern may not be complete. Only a decisive break below the lower trend line which arrested Friday's decline would give us the needed confirmation that 2135 is, indeed, more than a short-term top.
FREE TRIAL SUBSCRIPTION
If precision in market timing for all time framesis something that you find important, you should
Consider taking a trial subscription to my service. It is free, and you will have four weeks to evaluate its worth. It embodies many years of research with the eventual goal of understanding as perfectly as possible how the market functions. I believe that I have achieved this goal.
For a FREE 4-week trial, Send an email to: info@marketurningpoints.com
For further subscription options, payment plans, and for important general information, I encourage
you to visit my website at www.marketurningpoints.com. It contains summaries of my background, my
investment and trading strategies, and my unique method of intra-day communication with
subscribers. I have also started an archive of former newsletters so that you can not only evaluate past performance, but also be aware of the increasing accuracy of forecasts.
Disclaimer - The above comments about the financial markets are based purely on what I consider to be sound technical analysis principles uncompromised by fundamental considerations. They represent my own opinion and are not meant to be construed as trading or investment advice, but are offered as an analytical point of view which might be of interest to those who follow stock market cycles and technical analysis.
Andre Gratian Archive |
© 2005-2022 http://www.MarketOracle.co.uk - The Market Oracle is a FREE Daily Financial Markets Analysis & Forecasting online publication.