Prepare Now For the Epic Crisis in Central Banking
Stock-Markets / Central Banks Jun 04, 2015 - 06:17 PM GMTBy: Graham_Summers
 Last year (2014) will likely go down in history as the “beginning of the end” for the current global Central Banking system.
What will follow will be a gradual unfolding of the next crisis and very likely the collapse of the Central Banking system as we know it.
However, this process will not be fast by any means.
Central Banks and the political elite will fight tooth and nail to maintain the status quo, even if this means breaking the law (freezing bank accounts or funds to stop withdrawals) or closing down the markets (the Dow was closed for four and a half months during World War 1).
There will be Crashes and sharp drops in asset prices (20%-30%) here and there. However, history has shown us that when a financial system goes down, the overall process takes take several years, if not longer.
By way of example let us consider the details surrounding the Tech Bubble: the single largest stock market bubble of the last 100 years.
In this case, the Bubble pertained to just one asset class (stocks). In fact, the bubble was relatively isolated to one specific sector, Tech Stocks.
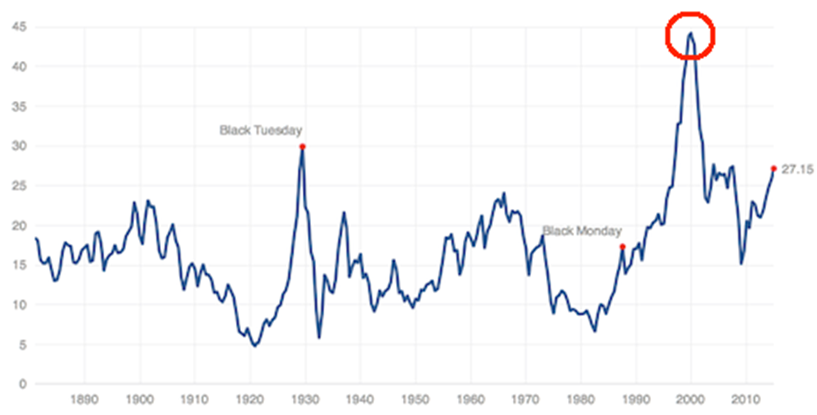
And to top if off, it was absolutely obvious to anyone that it was a Bubble: note that the Cyclical Adjusted Price to Earnings or CAPE ratio for the Tech Bubble dwarfed all other bubbles dating back to 1890 (see the next page).
Stocks were so obviously overvalued that it was truly absurd.

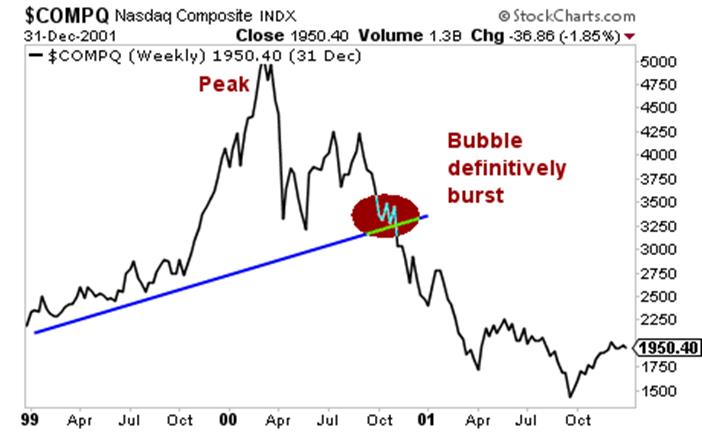
And yet, despite the fact that this bubble was absolutely obvious and involved only one asset class, it still took investors well over six months after the initial 20% crash to realize that the top was in and the bubble had burst.

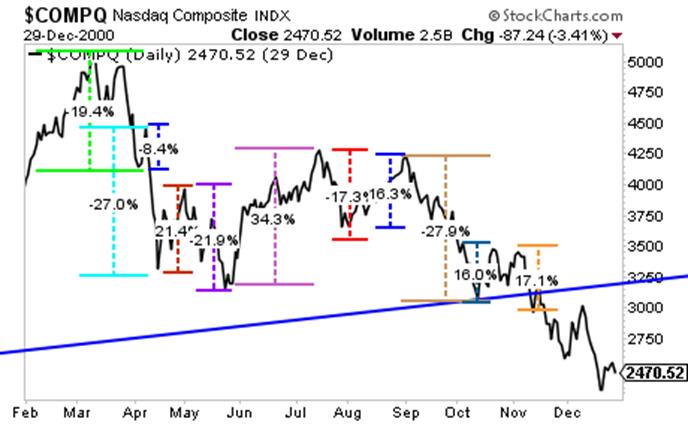
Moreover, during this six month period in which the single largest stock market bubble of all time burst, stocks did NOT go straight down. In fact, they were an absolute ROLLER COASTER with more than EIGHT price swings of 16% or greater.

Let that sink in for a moment. Stocks were clearly in a bubble. Indeed, it was literally THE stock bubble of the last 100 years. And yet, when it burst, there was no clear consensus as to where the market was heading.
In a six month period, investors moved stocks down 19%, up 8%, then down 27%, then up 21%, then down 22%, then up 34%, then down 17%, then up 16%, then down 28%, then up 16%, and finally down 17%. Only at that point did stocks break their trendline for the bubble (the blue line) and it became obvious that the bubble had burst.
My point with all of this is that even when the bubble was both very specific AND obvious, the collapse was neither quick nor clean. There were several large 20%+ crashes, but overall, it was a roller coaster with jarring rallies than gradually wore its way down.
This same process has likely begun again… but this time it will be global in nature as the bubble in question is not just in stocks but in bonds, commodities, real estate… indeed in the very Central Banks themselves.
The situation is clear: the 2008 Crisis was the warm up. The next Crisis will be THE REAL Crisis. The Crisis in which Central Banking itself will fail.
If you've yet to take action to prepare for this, we offer a FREE investment report called the Financial Crisis "Round Two" Survival Guide that outlines simple, easy to follow strategies you can use to not only protect your portfolio from it, but actually produce profits.
We are making 1,000 copies available for FREE the general public.
To pick up yours, swing by….
http://www.phoenixcapitalmarketing.com/roundtwo.html
Best Regards
Graham Summers
Phoenix Capital Research
http://www.phoenixcapitalmarketing.com
Graham also writes Private Wealth Advisory, a monthly investment advisory focusing on the most lucrative investment opportunities the financial markets have to offer. Graham understands the big picture from both a macro-economic and capital in/outflow perspective. He translates his understanding into finding trends and undervalued investment opportunities months before the markets catch on: the Private Wealth Advisory portfolio has outperformed the S&P 500 three of the last five years, including a 7% return in 2008 vs. a 37% loss for the S&P 500.
Previously, Graham worked as a Senior Financial Analyst covering global markets for several investment firms in the Mid-Atlantic region. He’s lived and performed research in Europe, Asia, the Middle East, and the United States.
© 2015 Copyright Graham Summers - All Rights Reserved
Disclaimer: The above is a matter of opinion provided for general information purposes only and is not intended as investment advice. Information and analysis above are derived from sources and utilising methods believed to be reliable, but we cannot accept responsibility for any losses you may incur as a result of this analysis. Individuals should consult with their personal financial advisors.
Graham Summers Archive |
© 2005-2022 http://www.MarketOracle.co.uk - The Market Oracle is a FREE Daily Financial Markets Analysis & Forecasting online publication.


