


The Dow Just Gave Stock Investors a “Buy” Signal... Did You Miss It?
Stock-Markets / Stock Markets 2015 Jun 04, 2015 - 02:20 PM GMTBy: Investment_U

 Matthew Carr writes: I’ve been passionate about art my whole life.
In fact, I spent a large chunk of my undergrad years studying the various techniques used in digital design... painting... photography... and animation.
One of the first things you learn in animation is the bouncing ball.
Whether you’re using a computer program like Flash or Maya, or drawing it by hand (which no one really does anymore), you have to understand the physics behind a bouncing ball...
Height, velocity, gravity, acceleration, elasticity, time, etc.
All of this comes into play when making the realistic image of a ball bouncing and losing energy until it rolls or it stops. Something like this:
The shortcut I remember is simply taking the initial height, multiplying it by 0.75 and then multiplying each result by 0.75 to get the peak of each bounce.
Why do I bring this up? Because that’s what the markets - at the least the Dow Jones Industrial Average - remind me of now. A bouncing ball running out of steam.
With each new bounce, there’s less and less energy.
Fear of Heights Dwindling
As most are well aware, year-to-date, the Dow hasn’t done much of anything. The blue chip index is up just over 1% so far.
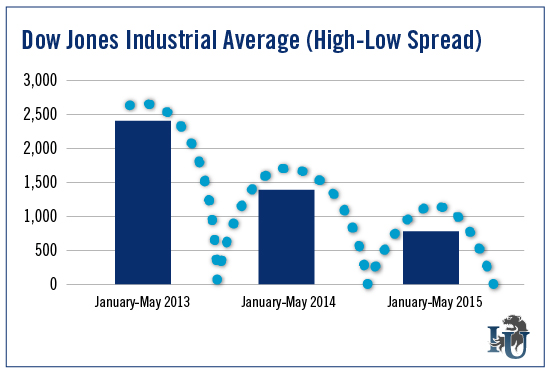
And the range we’ve been trading in so far in 2015 has been extremely tight. Our low is 17,037.76. And our high is 18,351.40. That’s a spread of 7.71%, or 1,313 points from low to high.
Now, that may seem like a lot. But when we look at the high-low spread during the same stretch over the past several years, we can see it’s a lot tighter.
For example, from January through May 2014, the spread was 9.1% - or 1,395 points. In 2013, during the same stretch, the spread was 18.81% - or 2,438 points. And over the past three months, that spread between high and low has narrowed to 4.39% or 772 points.
That means we have a lot of ups and downs, but not a lot of movement in either direction.
Like a ball bouncing and running out of energy...
Don’t Fight the Trend
The one great thing about this current market is the low point is fairly well defined.
Since breaking above 18,000 in December 2014, however, investors are unsure of what to do with the Dow. Looming questions over the economy... whether the contraction in the first quarter was merely “transitory” or a warning of something larger... and the impact of the stronger dollar...
These are all creating resistance to the upside.
Nonetheless, the Dow set new all-time highs in February, March and May. But the gain from that December 2014 high to its last all-time high in May is just a paltry 1.37%... or 247 points. Which really just represents one good day in the market.
At the same time, the Dow hasn’t fallen below 17,000 during the last seven months. We’ve seen consistent support at the 100-day moving average, which at the moment is 17,915.
This provides us with a very simple plan of attack: Any time the Dow dips below 18,000, we’re looking at a buying opportunity.
Over the last three months, our lowest points have been 17,579.27 in March, 17,585.01 in April and 17,733.12 in May.
The low in May happened after a two-day 2.43% decline from a peak of 18,175.66. The low in March was after a 3.9% decline from a peak to start the month at 18,288.63 (a new all-time high). The low in April was the first day of the month, five sessions after the low in March.
At the moment, the Dow is about 1.37% off its last all-time high set on May 19. Its total move lower was 2.1% to 17,967.74, hit on the final day of trading in May.
So, what I’ve laid out here is something very basic. And very bullish.
This is also important since we’re entering the Summer Lull, when the markets largely trade sideways because of lower volumes. (It’s during these months that traders move from staring at their computer screens to staring at the ocean - or whatever else they choose to ogle on their vacations.)
The Dow hasn’t set a new lower low since February. That lowest low was intraday on February 2. And it has hit higher highs in the months since.
If it dips below 17,915 then there might be something more dramatic on the horizon in the near term. But until the current trend breaks, you should consider any move below 18,000 an opportunity to get in and ride the bounce up.
Good investing,
Matt
Copyright © 1999 - 2015 by The Oxford Club, L.L.C All Rights Reserved. Protected by copyright laws of the United States and international treaties. Any reproduction, copying, or redistribution (electronic or otherwise, including on the world wide web), of content from this website, in whole or in part, is strictly prohibited without the express written permission of Investment U, Attn: Member Services , 105 West Monument Street, Baltimore, MD 21201 Email: CustomerService@InvestmentU.com
Disclaimer: Investment U Disclaimer: Nothing published by Investment U should be considered personalized investment advice. Although our employees may answer your general customer service questions, they are not licensed under securities laws to address your particular investment situation. No communication by our employees to you should be deemed as personalized investment advice. We expressly forbid our writers from having a financial interest in any security recommended to our readers. All of our employees and agents must wait 24 hours after on-line publication or 72 hours after the mailing of printed-only publication prior to following an initial recommendation. Any investments recommended by Investment U should be made only after consulting with your investment advisor and only after reviewing the prospectus or financial statements of the company.
Investment U Archive |
© 2005-2022 http://www.MarketOracle.co.uk - The Market Oracle is a FREE Daily Financial Markets Analysis & Forecasting online publication.